Lower East Branch-Wapsipinicon River Subwatershed
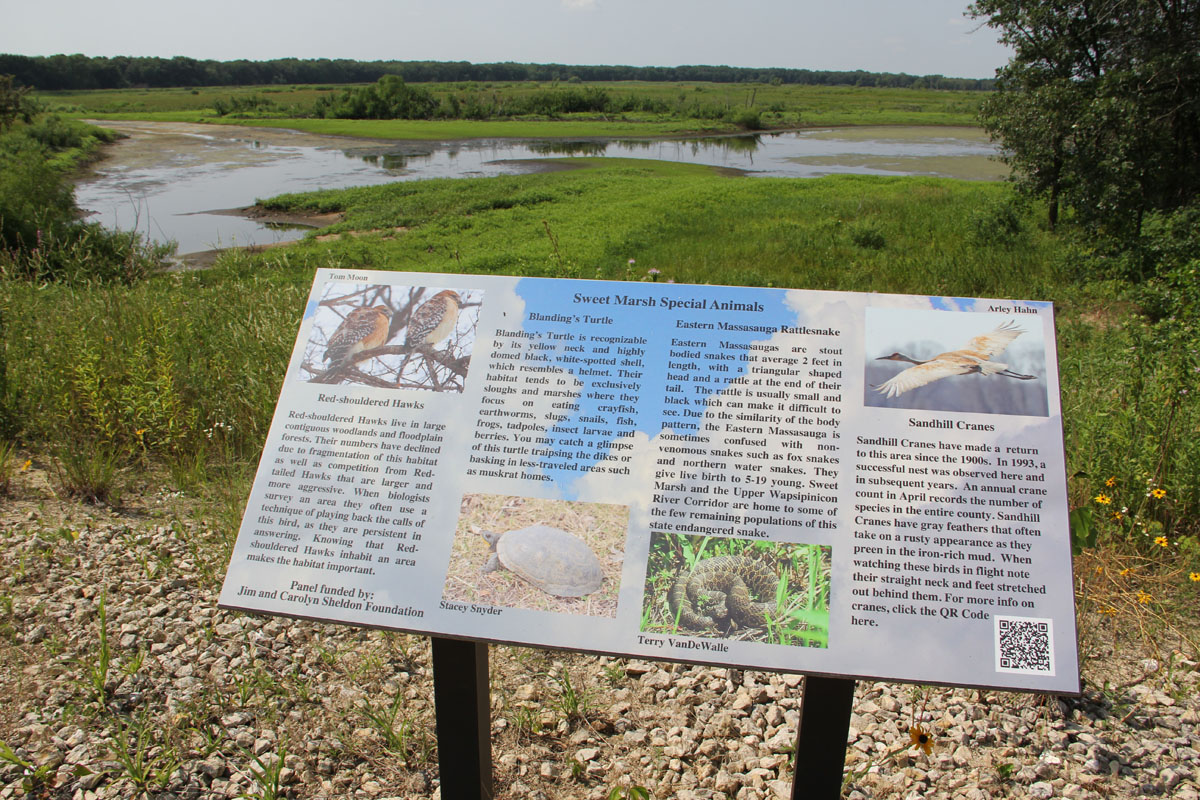
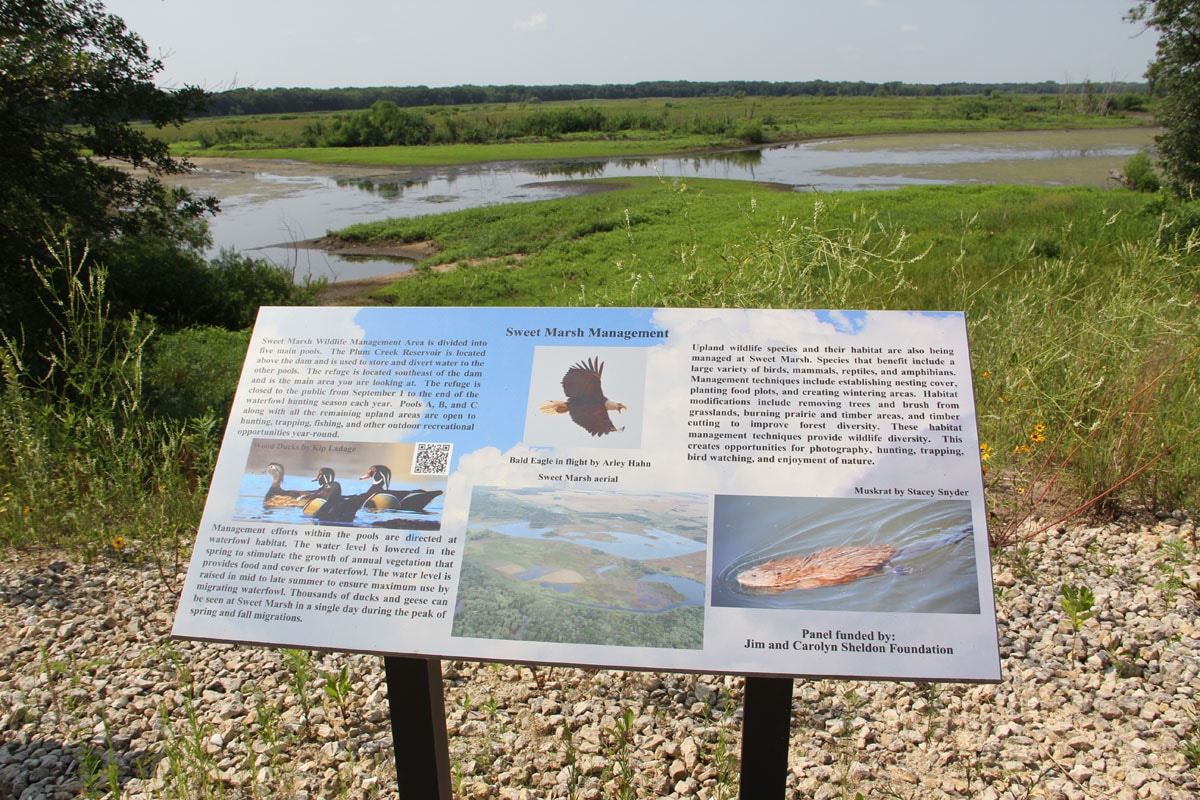
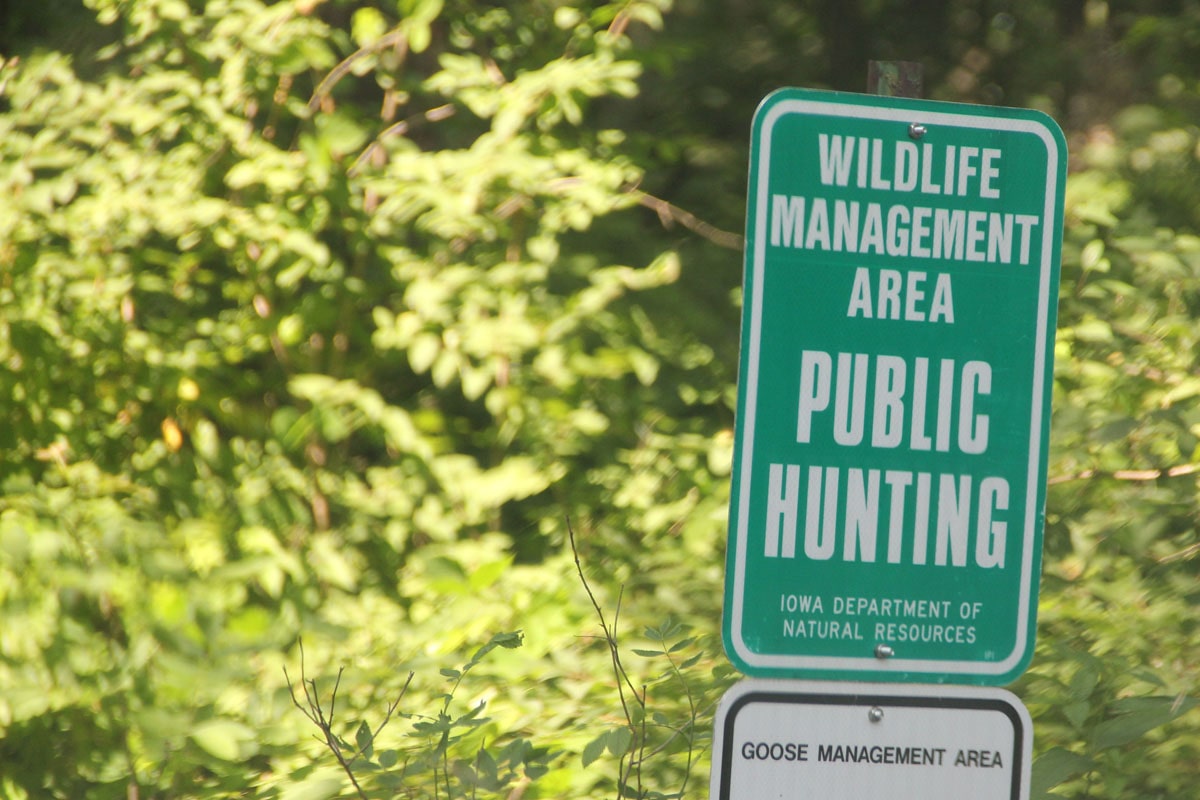
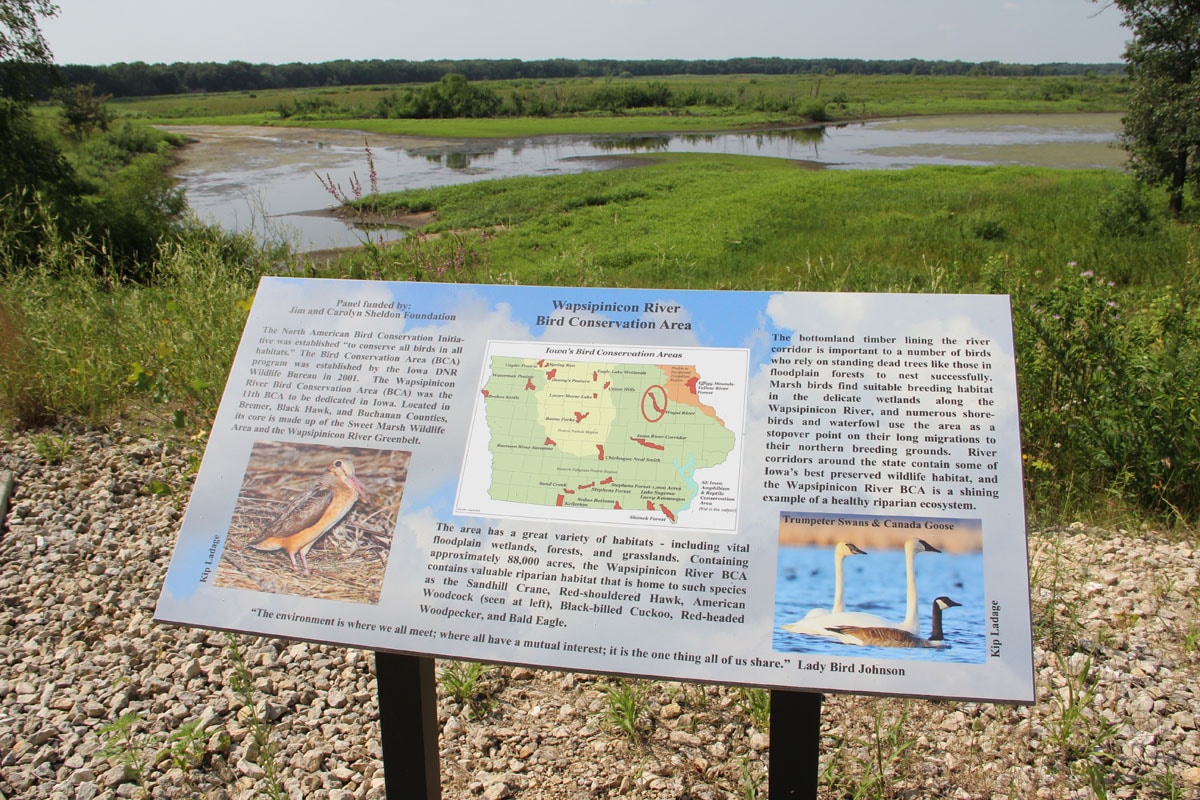
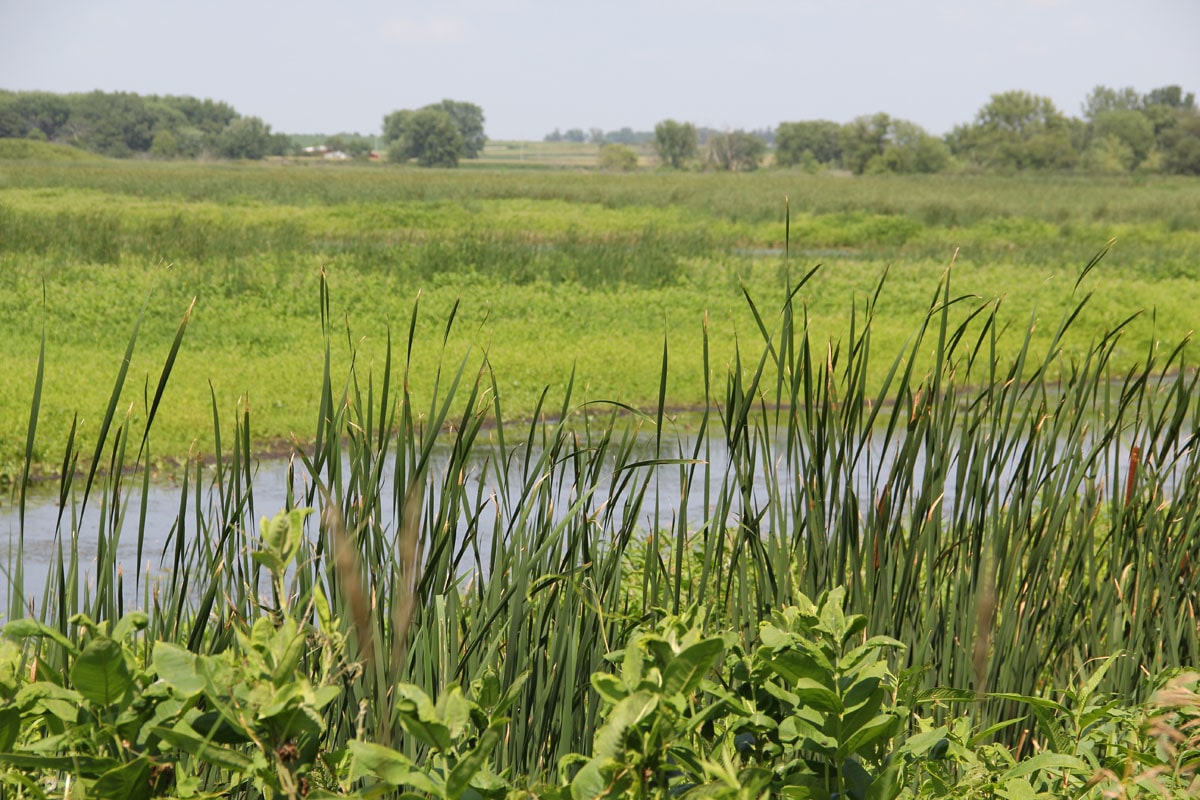
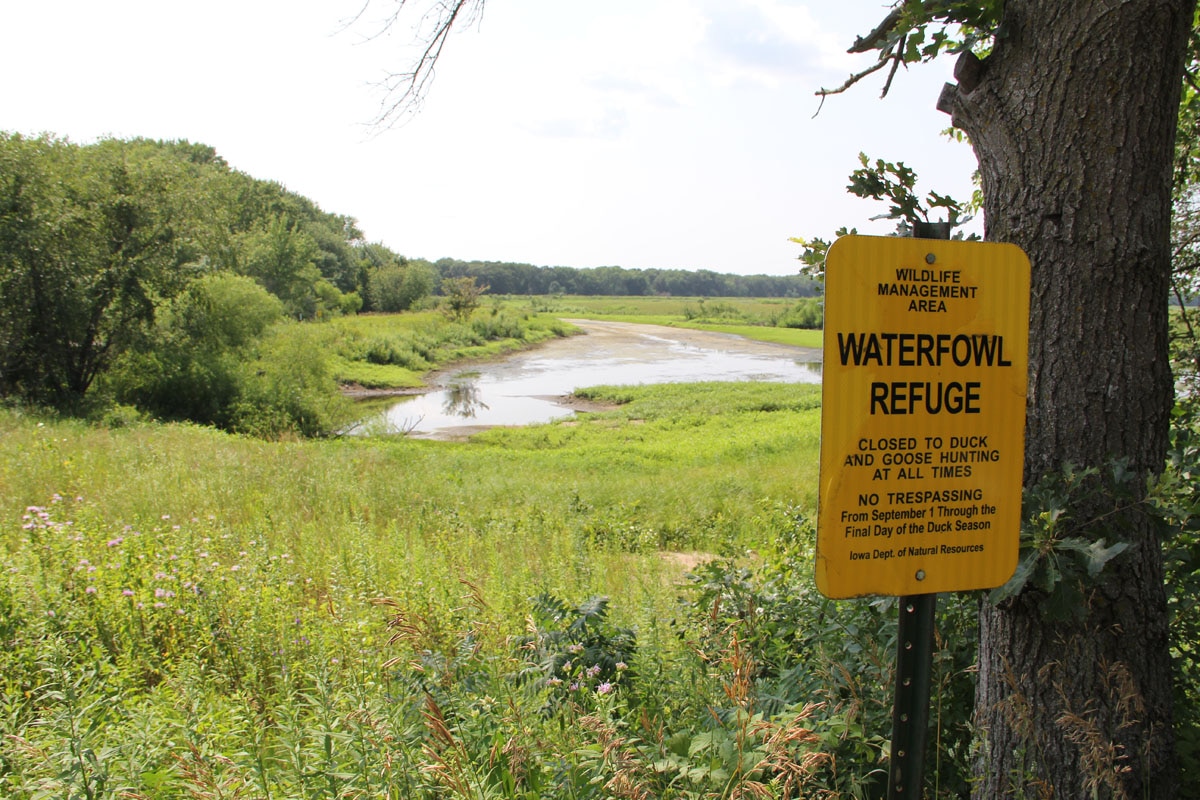
Lower East Branch Wapsipinicon River subwatershed contains the location where the East Wapsipinicon River empties into the main branch of the Upper Wapsipinicon River. At the mouth of the river, the land cover consists of wooded wetlands, grasslands, and other wetland types. This subwatershed contains two park areas, Split Rock Park and Plum Creek Wildlife Area. Split Rock Park is the largest and most highly used park managed by Chickasaw County conservation. It offers fishing, camping, hiking, and other recreational activities. Plum Creek Wildlife Area is a 468-acre park available for hunting, fishing and nature viewing.
Subwatershed Stats
- HUC #: 070801020303
- Watershed Acres: 24,508
- Total Length of Stream: 12.5 miles
- Stream and Watershed Designations: 10.4 miles of A1 B(WW-2) class streams (Read about the designations)
- Length of Stream Impairments (2018): 6.5 miles
- Number of CAFOs (2018): 4
- Percent Subwatershed in Cover Crops (2017): 0.17%
- WMA Priority Subwatershed: Yes


Background Info
Land Cover (2016)
The map and pie chart below illustrate land use in the Lower East Branch-Wapsipinicon River Watershed. Land cover information for the entire Upper Wapsi River Watershed, as well as information on historical cover, land ownership, and livestock production, can be found on the Land Cover/Land Use page.


Geological Snapshot
The Lower East Branch Upper Wapsipinicon River Subwatershed is located in the Iowan Surface landform region. The physical characteristics of this landform region contain numerous clues to Iowa’s glacial history. The Iowan Surface also contains some Karst features, such as sinkholes, influence hydrology and provide unique challenges with implementation of detention structures like ponds and WASCOBs.Water Quality Sampling Data
The Upper Wapsipinicon River WMA monthly takes a monthly water sample snapshot at locations across the watershed. More information about water sampling in the Upper Wapsi River Watershed and results for Nitrate, Phosphorus, Total Suspended Solids, E. Coli Bacteria, Chloride, and Sulfate are all available.
Iowa DNR Water Sampling Results
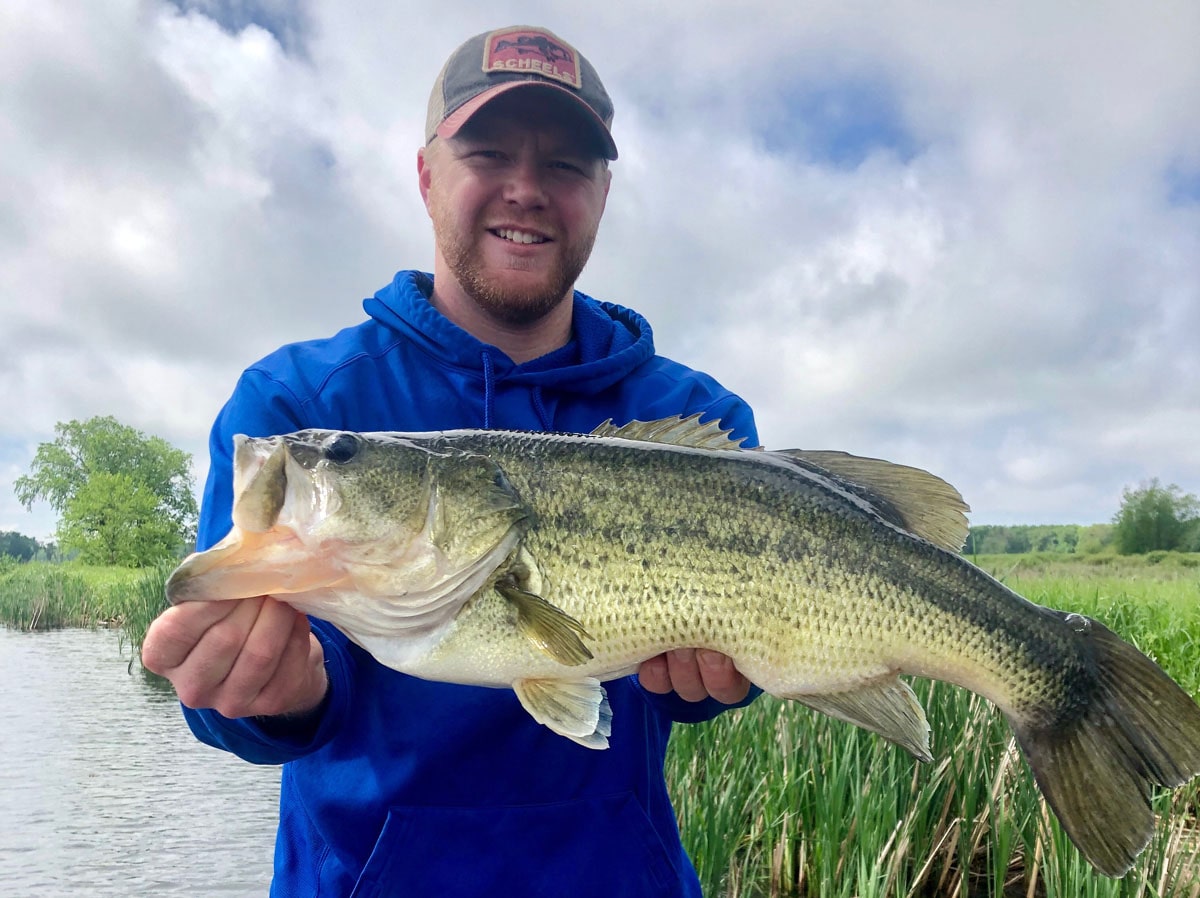
Fishery
Lower East Branch Wapsipinicon River was last surveyed for fish species in 2014 by the Iowa DNR. The Fish Index of Biotic Integrity (FIBI) results showed Lower East Branch Wapsipinicon River containing a variety of common and rare warm water fish species such as Bigmouth Shiner, Spotfin Shiner, Common Carp, and Common Shiner. Check out the Iowa DNR BioNet website to see the full results of the FIBI and others relating to river and stream biological monitoring.
Impairments
This watershed contains a segment of the eastern branch of the Upper Wapsipinicon River. It is listed on the Iowa DNR’s impaired waters list due to a low biotic index including fish and invertebrate species.
Precipitation and Soil Erosion
The Daily Erosion Project estimates soil erosion and water runoff occurring on hill slopes in Iowa and surrounding states. Compare Lower East Branch-Wapsipinicon River subwatershed with other watersheds in the Upper Wapsi or with watersheds across the Upper Midwest at https://www.dailyerosion.org/map
Analysis of Existing Agricultural Practices
Cover Crop Analysis
Although landowners utilize cover crops on their own and through conservation programs, cover crop usage has never been tracked spatially. Northeast Iowa RC&D completed a GIS analysis to estimate total acres and geographical location of cover crops using 2017 satellite and aerial imagery. Total percentage of the entire subwatershed treated using cover crops as well as the percent crop acres treated using cover crops were calculated.
In 2017, there were 42.2 acres of cover crops covering 0.25% of crop acres in the Lower East Branch-Wapsipinicon River subwatershed as compared to 3.1% for the State of Iowa (2017-2018 Iowa Nutrient Reduction Strategy Annual Progress Report and 2017 USDA/NASS Field Crop Totals).
Best Management Practice (BMP) Mapping Project Summary
A GIS analysis was conducted by Iowa State University (ISU) as a part of the Iowa BMP Mapping Project. According to ISU, “The Iowa BMP (Best Management Practices) Mapping Project provides an accurate inventory of BMPs which are essential to establish baseline conditions and document implementation resulting from the Iowa Nutrient Reduction Strategy. The primary focus of this project [was] to create the 2010 baseline inventory dataset, covering a period from 2007-2010 by digitizing conservation practices using aerial imagery and LiDAR derivative data.” The project specifically identified existing BMP structures that could be viewed on aerial imagery, including ponds, water and sediment control basins (WASCOBs), terraces, grass waterways, and contour buffer strips. The Iowa Best Management Practice (BMP) Mapping Project identified 18 pond structures and 83 WASCOBs in the Lower East Branch-Wapsipinicon River subwatershed. Lower East Branch-Wapsipinicon River also contains many miles of existing grass waterways and fields with contour buffer strips, which provide deep-rooted vegetation within agriculture fields to help infiltrate and hold water.
Interactive & Static Maps of Existing BMP Practices
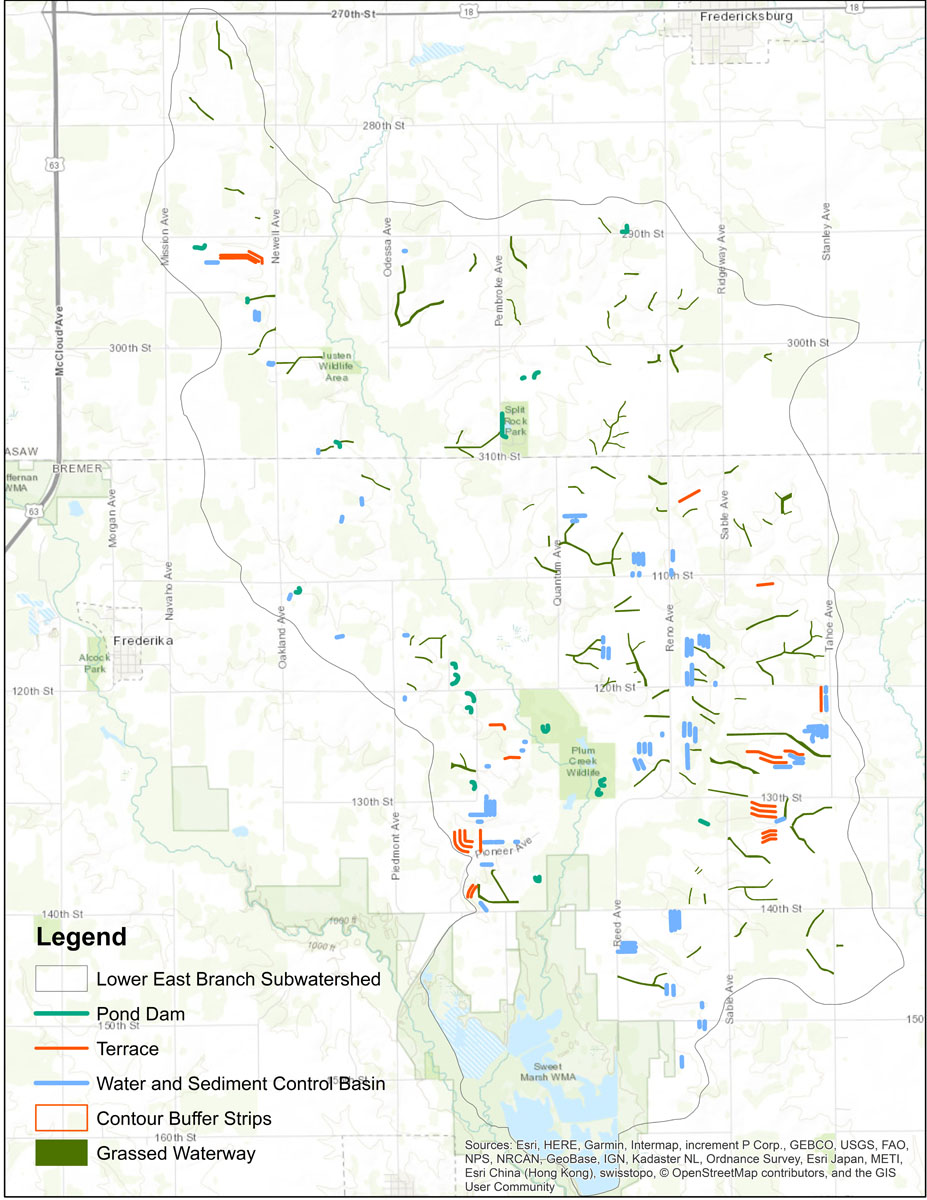
Legend
Additional Ag Conservation Practice Options
Iowa Flood Center: Agricultural Planning Framework Toolbox Results
The Agricultural Conservation Planning Framework (ACPF) is a concept for agricultural watershed management supported by high-resolution data and an ArcGIS toolbox, which are used to identify site-specific opportunities to install conservation practices across small watersheds. This non-prescriptive approach provides a menu of conservation options to facilitate conservation discussions on farms and in community halls. The framework is used in conjunction with local knowledge of water and soil resource concerns, landscape features, and producer conservation preferences to provide a better understanding of the options available in developing a watershed conservation plan.
In 2018, the Iowa Flood Center utilized the ACPF toolbox software to map ideas for conservation practices in the Upper Wapsi River subwatersheds. A map and a summary of results for Lower East Branch-Wapsipinicon River follow:
- 37.2% of the watershed could be treated with ponds, WASCOBs, grassed waterways, and contour buffer strips. This would slow or infiltrate water from 9,100 acres of the Lower East Branch-Wapsipinicon River subwatershed.
- 20 potential ponds and 19 potential WASCOB structures could be implemented in the subwatershed.
- Some of the potential structures identified using the ACPF tool have already been implemented and can be seen in the results of the BMP Mapping Project and through Chickasaw and Bremer County SWCD and NRCS reports.
Legend
Hydrologic Assessment
The Upper Wapsipinicon Hydrologic Assessment modeled land cover changes throughout the watershed and its effect on the historic peak flows at six different index points. Index points are located at 1) East Fork Wapsipinicon River, 2) Wapsipinicon River near Tripoli (USGS Gauge), 3) Little Wapsipinicon River, 4) Wapsipinicon River at Independence (USGS Gauge), 5) Buffalo Creek, 6) Wapsipinicon River upstream from Anamosa. According to the Upper Wapsipinicon River Watershed Hydrologic Assessment, these points were chosen based on several criteria including the location of a USGS gauging station, areas of high-risk potential and/or proximity to a community, and to demonstrate the model results at different spatial scales."
The GHOST model used peak flows from 15 of the highest rainfall events from 2002 to 2016 as a baseline. The nearest index point to the Lower East Branch-Wapsipinicon River subwatershed is located on the East Fork of the Wapsipinicon River before it joins with the main channel of the Wapsipinicon River. According to results in the Upper Wapsipinicon Hydrologic Assessment, if all ponds upstream of the index point, including Lower East Branch-Wapsipinicon River structures modeled by the ACPF tool were implemented, the index point on the East Fork of the Wapsipinicon River before it joins with the main channel of the Wapsipinicon River would experience a 16% peak flow reduction. Other Upper Wapsipinicon River index points downstream (South) do not show as great of reductions as the Upper Wapsipinicon River watershed index point on the East Fork of the Wapsipinicon River. The Hydrologic Assessment also modeled other land cover scenarios like 100% native vegetation and 100% cover crop/no-till rotations that show significant flow reductions at this index point.
Summary of Recommendations
|
Objective |
Practices/Actions |
Goal: Overall Discharge reduction of 12 inches from peak river level at Independence in 2008 |
|---|---|---|
|
Detention Structures |
|
|
|
Soil Health |
|
|
|
Perennial Cover |
|
|
|
Water Quality Improvement |
|
Implement Water quality improvement practices to reach the following goals:
|
|
Flood Plain Management |
|
|