
In the UWR Watershed, the intensity of precipitation events has increased and the number of people who have been impacted or know someone who has been impacted by flooding is significant. First-hand perspectives include:
- a family who survives a single flood event that destroyed their home;
- a business owner who loses all or part of their business to flooding one too many times;
- a farmer whose field was washed away – again;
- a commuter who has to travel 30 minutes out of their way because a bridge was washed out;
- a volunteer who has helped devastated flood victims recover;
- and a taxpayer who is frustrated with how much money the Federal Emergency Management Agency (FEMA) is spending to clean up flood damage rather than prevent it.
All have different perspectives on flooding, and the the multitude of perspectives associated with flooding in the UWR Watershed is as diverse as the population. Understanding the climate and hydrology of the watershed, past flood events, flooding frequency and precipitation trends, can help watershed residents and conservation planners to better prepare for future flood events, as well as to develop realistic goals and strategies to reduce future flooding and its economic, environmental and social impacts, especially on the most vulnerable populations.
A 2017 survey of the UWR Watershed landowners found the following.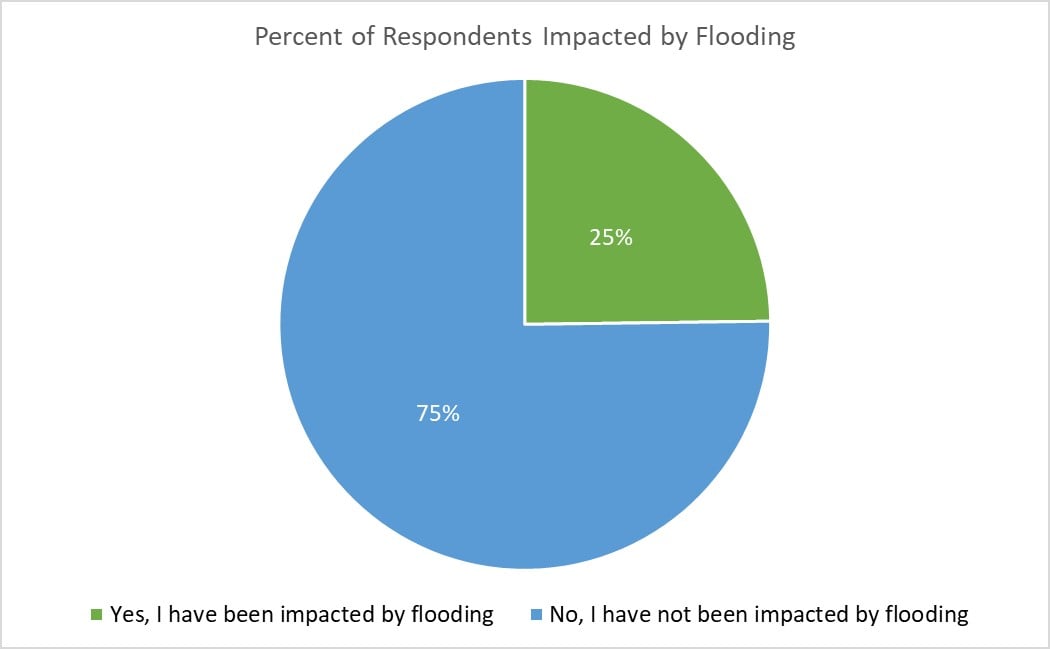
- 25% of respondents reported having their home, land or business impacted by flooding in the past 5 years
- Over 80% of respondents had been impacted by flooding more than 2 times in the past 5 year.
- 69% of respondents knew others impacted by flooding
- 68% of respondents reported that a road or bridge they use regularly was closed due to flooding.
- 85% percent of landowner respondents to the UWR Watershed Survey agreed or strongly agreed that flooding is a problem in the UWR Watershed and 71% disagree or strongly disagree that enough is being done in the UWR Watershed to reduce flooding.
The full report of the landowner survey summarizes the results of 251 respondents.
According to U.S. Climate Data, the annual temperature for Independence, which is centrally located in the watershed, is 48.2°F and the average annual precipitation is 34.76 inches. However, these statistics don’t tell the whole story. The record low temperature in Iowa is -47 degrees Fahrenheit and the record high 117 degrees Fahrenheit. Residents of the UWR Watershed experience four distinctly different seasons, spring, summer, fall and winter, with varying amounts of rainfall and snowfall, and instances of drought, flooding and extreme humidity.
It is interesting to note that while mean precipitation totals have not significantly changed in the last 50 years, the research presented in the UWR Hydrologic Assessment completed by the Iowa Flood Center shows the intensity of individual precipitation events has increased and is trending upward. The UWR Hydrologic Assessment notes the following. 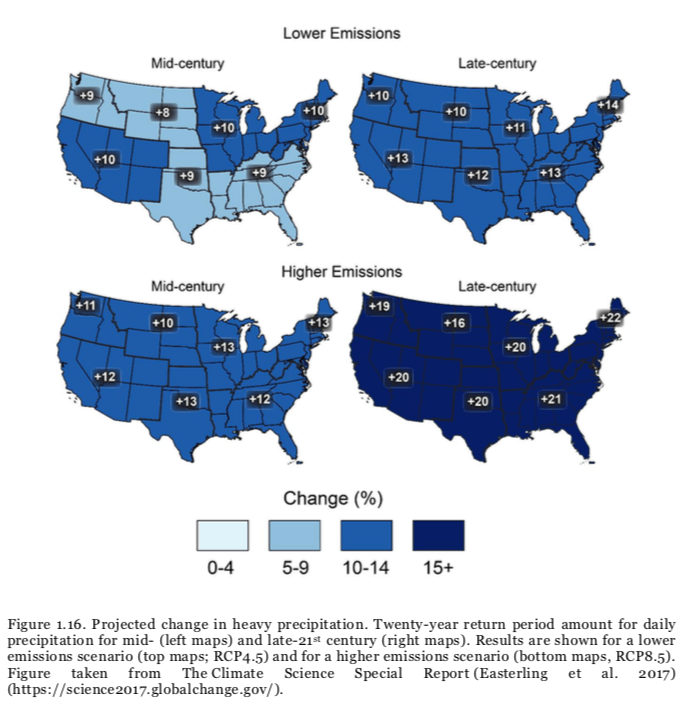
“Heavy rainfall is increasing in intensity and frequency across the United States and globally and is expected to continue to increase over the next few decades (2021–2050, see Figure 1.16), annual average temperatures are expected to rise by about 2.5°F for the United States, relative to the recent past (average from 1976–2005), under all plausible future climate scenarios.’’ Climate scientists predict precipitation intensity to continue increasing to levels 10-13% higher by mid-century (2050) and 11-20% by the end of the current century (2100).
The first major historic flood recorded in the Upper Wapsipinicon River basin in Iowa by the National Weather Service National Oceanic and Atmospheric Administration occurred in June, 1947. Their records note,
“Flooding remarkable for its extent and duration occurred across much of Iowa, as the state average rainfall was 10.33 inches, second only to June, 1993 rainfall (10.50 in.). Flooding was widespread across the entire state and in the LaCrosse HSA area as well. The most outstanding event in northeast Iowa occurred when intense thunderstorms on June 12-13 produced 4 to 5 inches of rain over parts of Bremer, Chickasaw and Fayette counties. Flooding was most severe along the Volga, Turkey rivers and Wapsipinicon rivers, where several towns (Volga, Littleport, Elkader and Elkport) were inundated. Damage to structures, roads and agricultural land was extensive. The flood crest at Garber on the Turkey River was 29,000 cfs, still the third highest on record.”
The 1947 flood event has since been surpassed, by 6 flood events at the USGS gauge in Independence. Overall, urban and rural land use changes in combination with climate change patterns, has resulted in a greater frequency of large flood events in the UWR Watershed over the past 25 years. Some communities and residents report that the recent frequency of events in the UWR Watershed has left the watershed in a perpetual state of recovery.
The Iowa Flood Center’s Hydrologic Assessment includes a breakdown of flood events in the UWR Watershed over the past 25 years, noting that flood events are
consistently becoming more frequent as the watershed experiences more frequent heavy rainfall events. Table 2.2 in the Hydrologic Assessment (Shown below) provides information on the historic crests of the UWR at the three river locations where the US Geological Survey (USGS) records stage, Tripoli, Independence and Anamosa. Each of the three large flooding events in the last ten years, June 2008, July 2010, and August 2016, were associated with 7–10 inches of rainfall over a one or two-day period. These floods disrupted travel, damaged farmland, homes and businesses and physically, emotionally, and financially impacted the UWR Watershed residents. Downstream residents were also impacted as floodwaters carried hazardous material and debris into fields and backwaters, impacting downstream farms and natural areas, water quality, and ecosystems in the UWR Watershed, the greater Wapsipinicon River Watershed, and the Mississippi River and its backwaters. Private and public properties, including county, state and federal lands were also impacted.
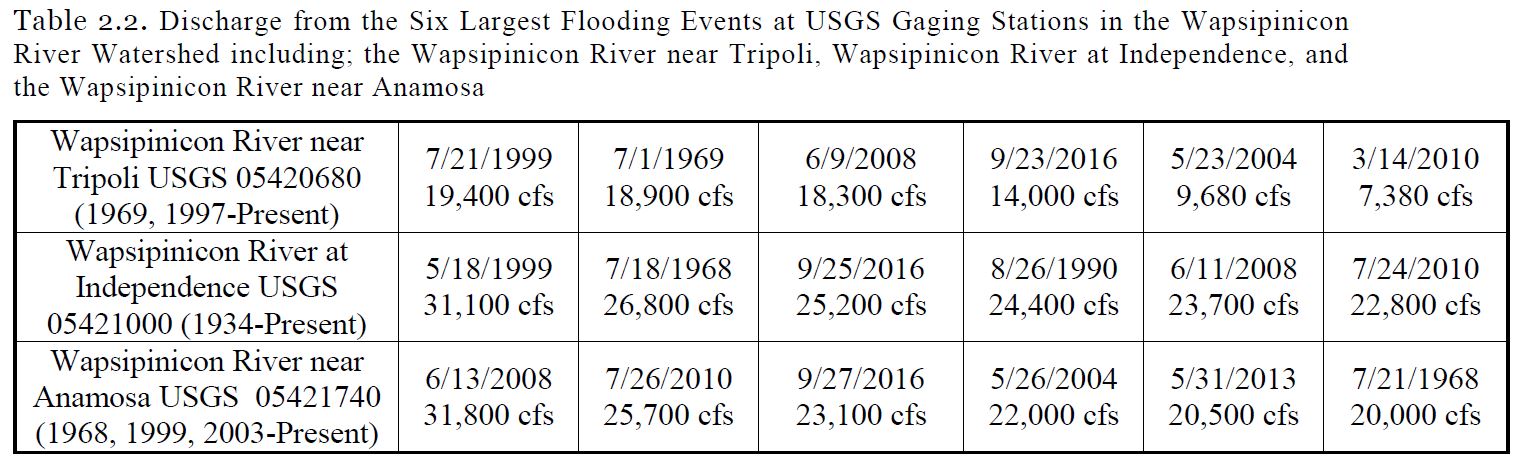
Chart courtesy of the UWRW Hydrologic Assessment