The ability to analyze various characteristics of any landscape, including the Upper Wapsipinicon River Watershed, using LiDAR, satellite imagery, innovative analytical computer software, and modeling programs has escalated in recent years. The capacity has not only increased in terms of the tools, but also in the availability, time commitment, and ease of analysis, making it possible for watershed partners to have a detailed understanding of existing conditions and be more realistic about potential watershed planning goals, objectives, and strategies. However, although technology and expertise exist, the analysis and modeling still takes time and costs money. Fortunately, the federal grant funding provided through the Iowa Watershed Approach, and the selection of the Upper Wapsipinicon River Watershed as one of the Iowa Watershed Approach target watersheds, provided funding for in-depth analysis of the Upper Wapsipinicon River Watershed. As a result, many different analyses were completed by regional and state partners for the Upper Wapsipinicon River Watershed, including a Cover Crop Analysis, the Iowa BMP Mapping Project, Agricultural Planning Framework Tool, Infrastructure Analysis, and a Hydrologic Analysis. This page summarized the methods and results of each analysis. Results are also available by HUC 12 subwatershed on the Upper Wapsipinicon Subwatersheds page. The results of these studies provide a detailed look at every farm and town in every part of the watershed. Looked at individually, each analysis informs; considered collectively, they reveal dynamic solutions and opportunities.
Cover Crop Analysis
Iowa Best Management Practice (BMP) Mapping Project
The Iowa Best Management Practice (BMP) Mapping Project was completed by Iowa State University and funded by Iowa DNR, IDALS, Iowa Nutrient Research Center at ISU, National Laboratory for Agriculture and the Environment and Iowa Nutrient Research and Education Council. The BMP Project provides an inventory of already existing conservation practices in watersheds across Iowa. BMPs were identified using different types of aerial imagery. Analysis of BMPs in the Upper Wapsipinicon River Watershed used LiDAR, infrared, and natural color imagery, from 2007 to 2010. Researchers from the project visually scanned the different imagery types to identify a variety of practices including, grass waterways, ponds, terraces, WASCOBs, contour strip cropping, and contour buffer strips. The results from the analysis were not ground-truthed to identify which practices are currently on the ground. Iowa State University recognizes that the identified practices may or may not have been constructed to any state or federal standard and that differences in actual practices on the ground may differ from those identified in the 2007 to 2010 LiDAR imagery, noting,
“We can’t guarantee that mapped practices meet NRCS standards or that they are actually the indicated practice since no ground truthing is being performed. Data being utilized to digitize the BMPs include LiDAR derived products such as DEM, Hillshade and Slope grids; CIR aerial photography from the 2007-2010 timeframe, NAIP aerial photography and historic aerial photography.”
The goal of the BMP project is to provide a relative baseline of data for conservation practices that are on the ground between the 2007 to 2010 time frame. This data can be used for extensive watershed modeling, documenting historical occurrences, and future practice tracking. Maps of these BMPs are available on individual subwatershed pages or the GIS data for each subwatershed can be downloaded from the ISU GIS Facility’s webpage. Results can be used by WMAs, County SWCDs, NRCS, Cities, and County Engineer/Secondary Road offices and others to evaluate the existing BMPs in their watersheds.
Links
Upper Wapsipinicon River Watershed Results
Subwatersheds in light-yellow, located in the northern portion of the Upper Wapsipinicon River Watershed, contain retention structures, contour buffer strips or grass waterways that treat over 30% of acres in each subwatershed. Majority of subwatersheds in the Upper Wapsipinicon River Watershed contain less than 10% of their acres treated by retention structures, contour buffer strips, or grass waterways. Results from the Iowa BMP Mapping Project directly correlate with previous landowner participation in the Upper Wapsipinicon River Watershed. Many of these practices were implemented because of voluntary landowner participation in Upper Wapsipinicon River subwatershed projects led by County Soil and Water Conservation Districts (SWCDs), and because of conservation programs available from USDA and implementation by USDA NRCS. Some producers implement conservation programs to protect their soil and water; other producers because they are required to implement conservation practices to keep their soil erosion below a recommended level if they want to participate in Farm Service Agency programs.


Agricultural Conservation Planning Framework Tool
The Agricultural Conservation Planning Framework (ACPF) is a set of Geographic Information System (GIS) based software tools used to identify potential locations for different types of conservation practices. It was developed at the USDA/ARS National Laboratory for Agriculture and the Environment in Ames, Iowa. It includes tools to process the LiDAR-based imaging and elevation models for hydrologic analysis, which then allows a series of prioritization, riparian classification, and conservation practice placement tools to be utilized. The ACPF Tools identify agricultural fields most likely to deliver runoff directly to streams. They also map and classify riparian zones to inform whole-watershed riparian corridor management and estimate the extent of tile drainage in the watershed. Conservation practices mapped using ACPF Tools include those that reduce, trap, and treat water runoff, and improve water quality. The ACPF Tools identify and map grass waterways, saturated buffers, denitrifying bioreactors, contour buffer strips, nutrient reduction wetlands, and water and sediment control basins (WASCOBs).
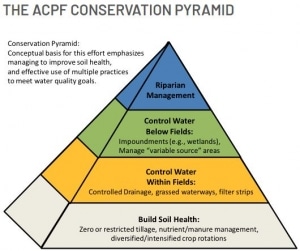
According to the ACPF Toolbox User’s Manual, “Results from applying these tools provide an inventory of opportunities for conservation practice placement at the Hydrologic Unit Code (HUC) 12 watershed scale, which is meant to help facilitate the watershed planning process.”
Graduate students and staff from the University of Iowa analyzed each HUC-12 subwatershed in the UWR Watershed using ACPF Tools. Results are used throughout the UWR Watershed Resiliency Plan and can be used by WMAs, County SWCDs, NRCS, Cities, and County Engineer/Secondary Road offices, and others to guide future projects and analyze potential conservation on the landscape.
Upper Wapsipinicon River Watershed Results
The map below shows the percent of potentially treated acres in each subwatershed. Subwatersheds in light-yellow have the most potential locations for implementation of water retention structures like ponds and WASCOBs. Subwatersheds with the highest potential are located in the southern half of the Upper Wapsipinicon River Watershed where the greatest flow reductions can be achieved according to the UWR Hydrologic Assessment.
When comparing results from the Iowa BMP Mapping Project and the ACPF tool, the greatest landowner participation has occurred in the Watsons Creek and Mead Creek Subwatersheds and others scattered throughout the Upper Wapsipinicon River Watershed. Landowner participation was lower in most of the other subwatersheds in the UWR Watershed. ACPF results showed the highest potential for implementation of flood reduction practices in most of the subwatersheds in the Upper Wapsipinicon River Watershed. ACPF results and the Iowa BMP Mapping Project can be used by County SWCDs, Counties, Cities, and landowners to target future subwatershed projects, and to see potential locations for implementation of flood reduction practices on their land.

Infrastructure Analysis
Public infrastructure in the UWR Watershed, particularly roads and bridges, often experience major damage due to flooding. Out of consideration for this public resource and to help with its management,o a variety of different analyses of UWR Watershed roads and bridges was completed by the Iowa DOT and the Northeast Iowa RC&D Watershed Planning Team.
The first analysis examined bridge conditions in the UWR Watershed. An Infrastructure Analysis of Bridges was completed to detect bridges that are at a higher risk for flood-related damage based on age, average daily traffic, structure type, and condition. GIS analysis was conducted using data from the National Bridge Inventory and Iowa DOT.
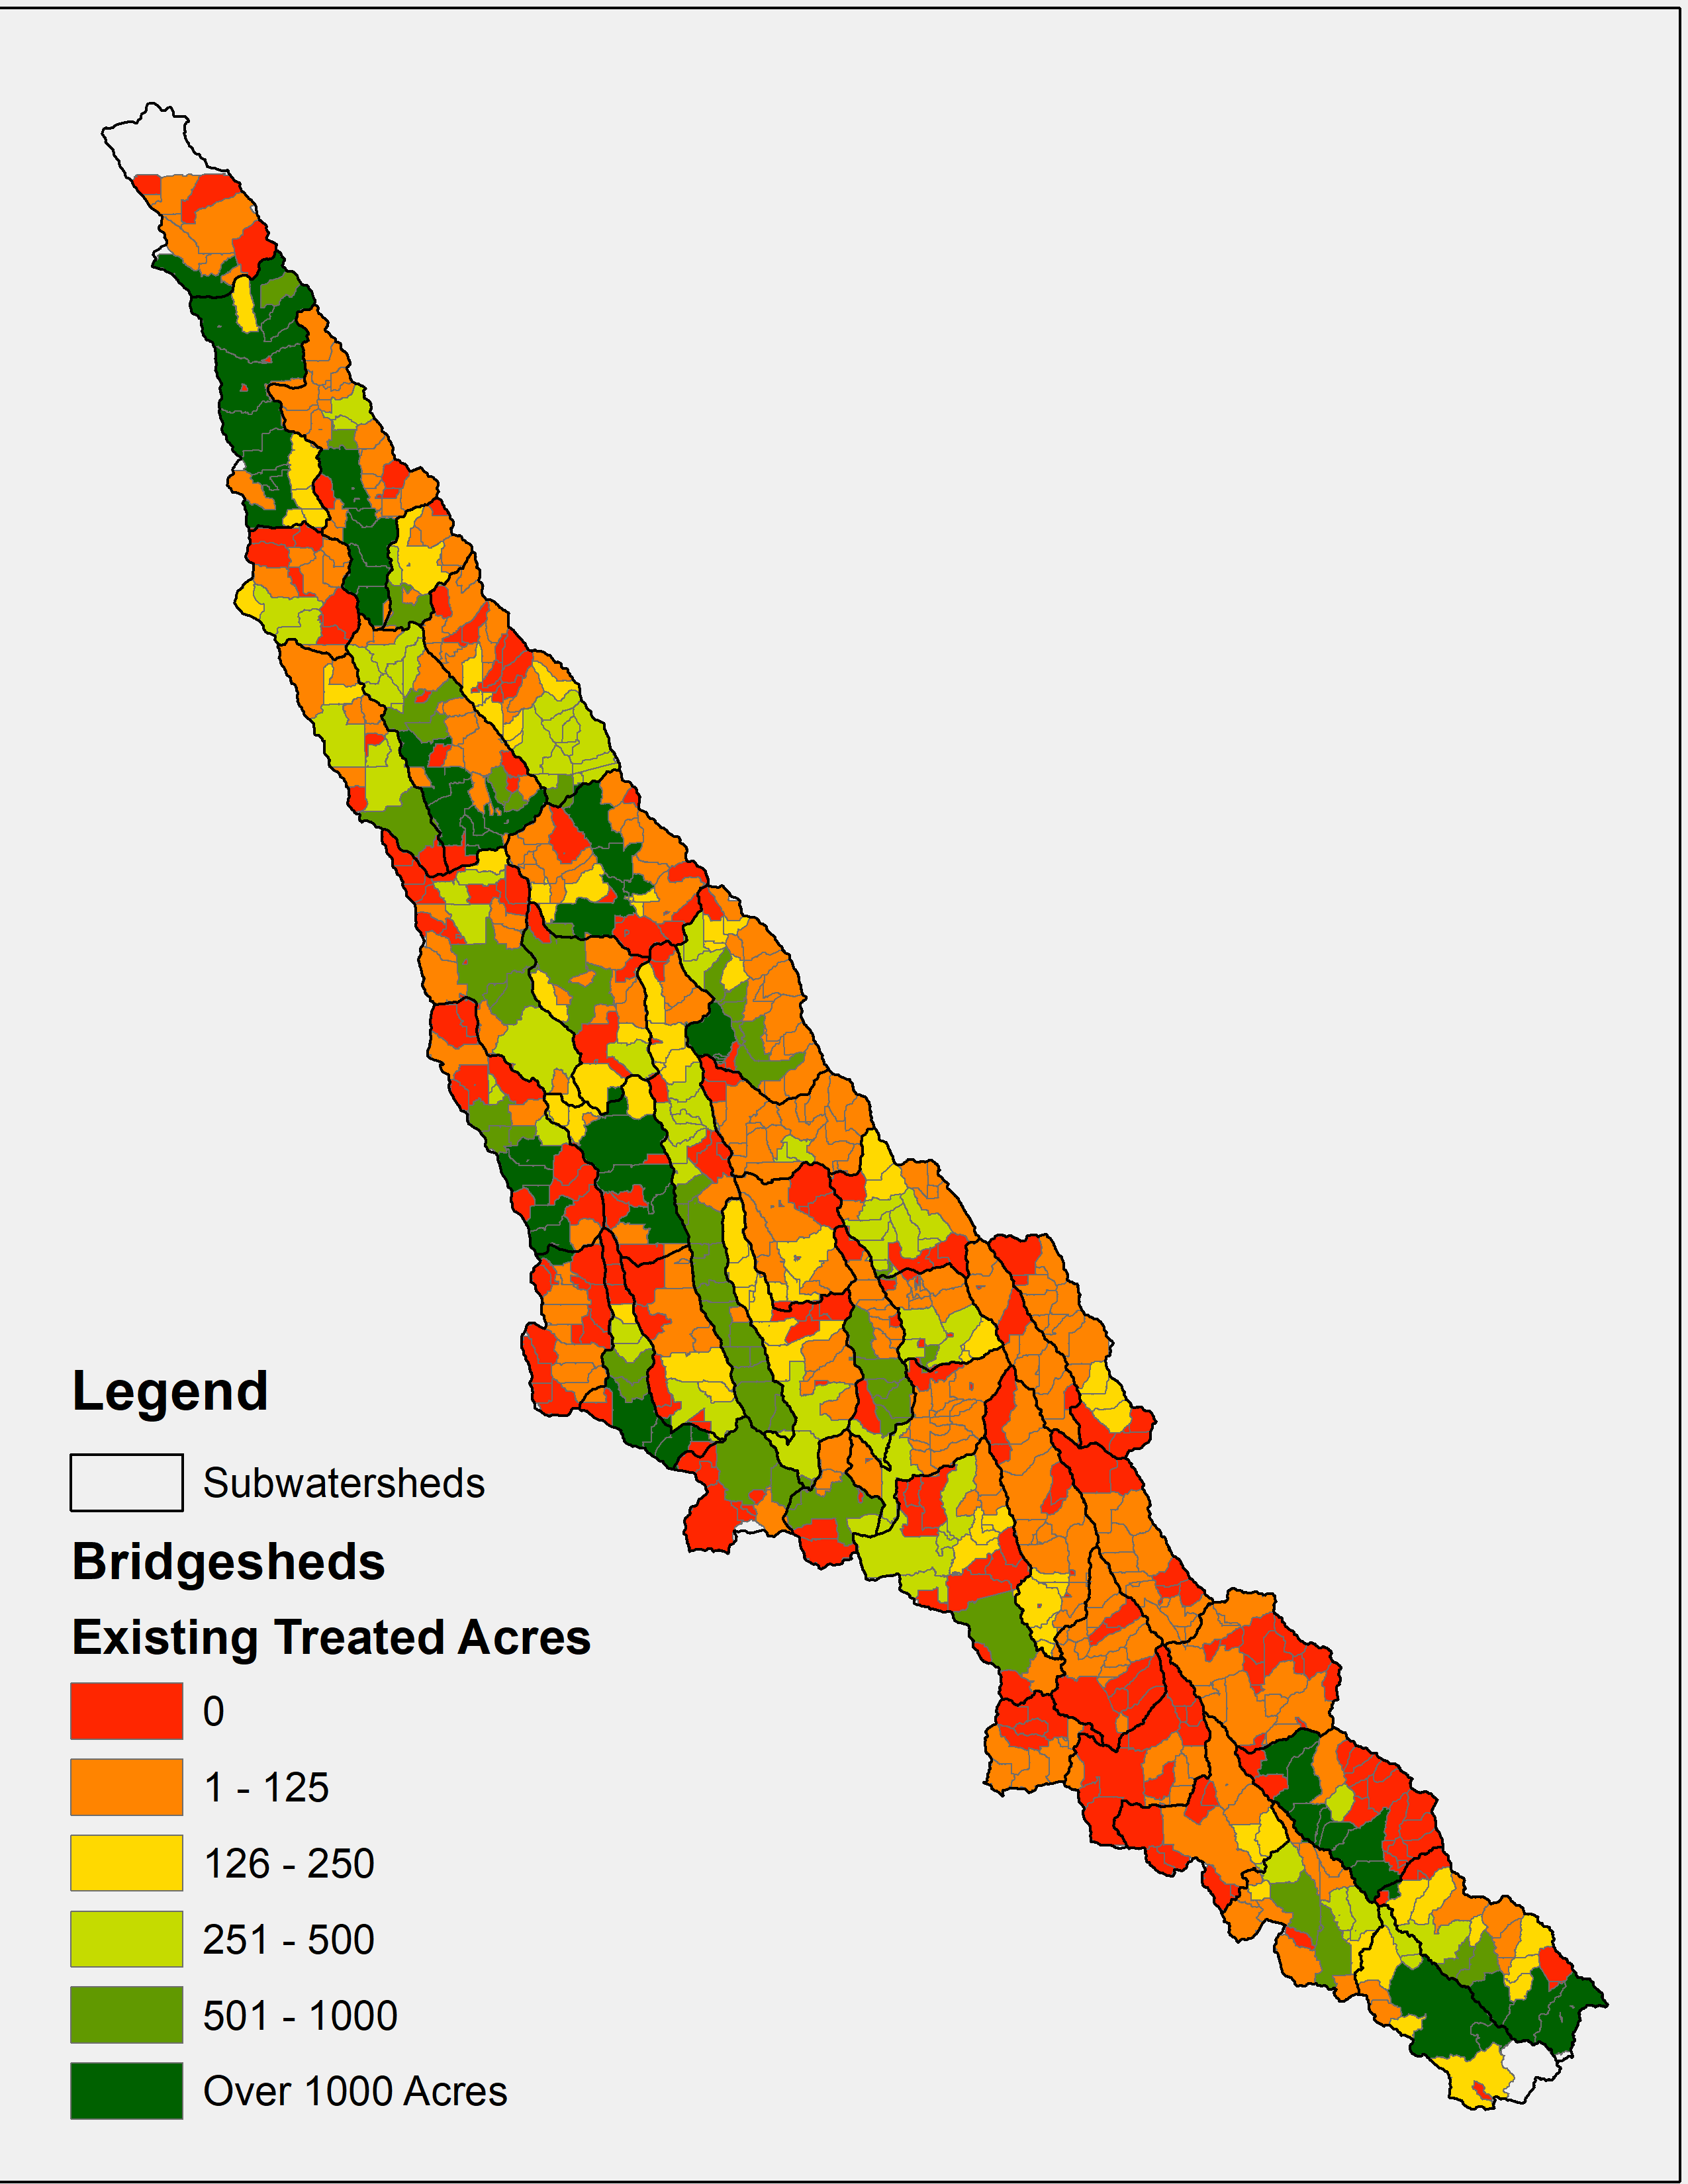 The Upper Wapsipinicon River Watershed Bridgesheds, defined as the area of land that drains to each bridge, were identified by the Northeast Iowa RC&D Watershed Planning Team using ArcGIS Spatial Analyst tools. Each bridgeshed was overlaid with results from the Iowa BMP Mapping Project to illustrate the relationship between existing conservation implementation and the area of land that drains to specific downstream infrastructure/bridges. Detention structures, including ponds and water and sediment control basins (WASCOBs), can hold water on the landscape and thus provide increased protection for downstream infrastructure, especially during high flow and during flood events. Bridgesheds were then spatially analyzed by subwatersheds to categorize the UWR subwatersheds based on presence or absence of existing conservation practices. Different conservation partners may utilize this analysis in different ways. Some conservation partners may prioritize conservation outreach, technical and financial assistance to those subwatersheds that have few existing conservation practices. These are shown in red on the map below. Other public entities may choose to prioritize bridge repair or investment in public infrastructure to the subwatershed/s where conservation practices are already in place, thus protecting their investment.
The Northeast Iowa RC&D Planning Team also used results from the ACPF tool (explained above) to determine potential “on-road structures” in the UWR Watershed, more specifically, pond structures in close proximity to roads were considered a potential location for an on-road detention structure.
On-road structures are designed and most typically incorporated into county road infrastructure. They are typically placed at a location in the landscape where a county roadway “dips” in elevation within the landscape, at a low elevation point along a roadway. County Engineers in the UWR Watershed prefer to locate these structures on secondary gravel roads, high up in the watershed, where overland runoff is intermittent or occurring only during rainfall events. To create the on-road structure, the road is built up to create a dam that can hold stormwater runoff temporarily. A special outlet culvert is installed in the structure so the structure will temporarily hold back water during a large rain event and then release it at a reduced volume over a few days. An easement/agreement between the landowner and the county is established allowing the water to be temporarily held on the private land. Responsibility for inspection and maintenance is also assigned. These structures have multiple benefits for the county, the public, and the upstream and downstream landowners. They may improve the safety of the roadway, protect the downstream public and private infrastructure, and reduce flow during rain events. They may also be designed to create a pond, provide water for livestock, and/or provide a water source for the fire departments (dry hydrant). These options are particularly desirable in rural areas where other water sources are scarce. This analysis is useful for landowners, County Engineers and Boards of Supervisors, City Councils, Fire Departments, rural road users, taxpayers, and anyone else looking to improve existing roadways, increase public safety, protect downstream private or public infrastructure, reduce streambank erosion, create new water sources for livestock, wisely use taxpayer dollars, or to accomplish many other goals.
Upper Wapsipinicon River Watershed Hydrologic Assessment
IIHR—Hydroscience & Engineering (IIHR) and the Iowa Flood Center (IFC) developed a hydrologic assessment of the UWR Watershed that provides the WMA, local leaders, landowners, and watershed residents with an understanding of the hydrology – the movement of water – within the UWR Watershed. This assessment provides valuable information for all stakeholders looking for guidance with strategic decision-making and those who are hoping to address flooding and water-quality concerns efficiently. Information in the hydrologic report informs all other sections of the watershed resiliency plan, making other types of analysis more relevant and providing context for decision making. It also helped planners quantify the hydrologic and other results of proposed actions.
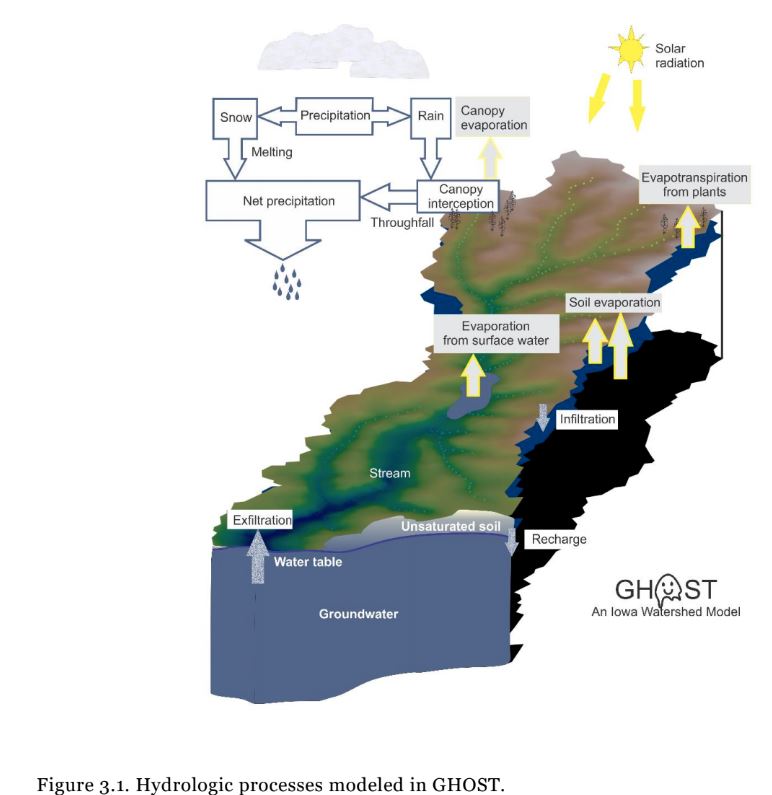
Diagram courtesy of the Upper Wapsipinicon River Watershed Hydrologic Assessment
The Upper Wapsipinicon River Watershed Hydrologic Assessment included advanced modeling using the integrated model GHOST developed at IIHR. The GHOST model simulates the hydrologic response within a watershed. According to the Upper Wapsipinicon River Watershed Hydrologic Assessment,
“The model takes into account Iowa’s varied topography, soils, and land use. GHOST is based on the open source hydrologic code MM-pihm (Qu and Duffy 2007, Yu et al. 2013), which fully couples surface and subsurface water systems to predict streamflow and groundwater movement for normal and extreme rainfall and snowmelt events. Specific models were developed at IIHR and incorporated into the code to properly predict water budgets for the long-term simulations required for the large-scale IWA watersheds. The main advantage of a physically-based model is that the model can be used for a wide range of applications and beyond the window of calibration. Best management practices (BMP) are resolved or modeled in GHOST depending on the structure scale.”
The Upper Wapsipinicon River Watershed Hydrologic Assessment helped the WMA Board and partners better understand dynamic rainfall patterns, watershed system hydrology, interactions between surface and ground water in karst systems, and how this UWRW Resiliency Plan must be responsive to related changes and therefore updated regularly.