
Given the size and scale of the UWR Watershed and the river, where rain falls on the landscape within the watersheds greatly impacts how, or if, river levels are influenced at any particular site along the river. There are many methods utilized by various agencies to gather and monitor past and current weather, river flow and other information that can be used to help forecast flooding in the UWR Watershed, including 8 stream gauges that continually monitor stream and river levels in the watershed, providing multiple benefits. Stream gauges help emergency managers, emergency responders, and watershed residents prepare and react to floods in the UWR Watershed. They can also be used to better understand flood trends and to calculate the economic loss of nutrients. Understanding how to access and utilize information from multiple sources and what that information means, including historic data, information from stream gauges, information from agencies like USDA, NOAA, FEMA, ISU Extension and others, can help local, state and federal partners forecast flooding and reduce the impacts of flooding. Some of the most significant and relevant data sources, information are provided below. Context for some of the language used by the various agencies is also provided.
USGS Gaging Stations
The National Oceanic and Atmospheric Administration (NOAA) and the Federal Emergency Management Agency (FEMA) gather data about weather and flooding in the United States. Their data is available online and provides a very detailed account of flooding events and rain data on the county scale. There is also agricultural data that is available to the public from a variety of sources like the United States Department of Agriculture (USDA) and Iowa State Extension (ISU). These resources provide valuable information that city and county officials, farmers, and residents can use to better understand past impacts and to inform decision making to minimize future impacts of flooding.
The National Weather Service (NWS) is the largest sub-agency of NOAA. The NWS provides real-time and past weather patterns including rain and river level data. They receive data from the USGS gauging stations throughout the nation. There are currently four U.S. Geological Survey (USGS) gauging systems in the UWR watershed. Three of them are located on the Upper Wapsi River and one is located on the Little Wapsipinicon River. Stream gauges need to continuously collect data for at least ten years to be able to make probability and forecasting estimations. Two of the four USGS gauges in the UWR Watershed are able to make probability and forecasting estimations that are very valuable to emergency managers and other emergency response personnel in the watershed. According to Emergency Managers in the UWR Watershed, the prediction feature of these gauges is vital to protecting community residents and reducing the future impacts of flooding(https://water.weather.gov/ahps2/index.php?wfo=arx).
Stream gauging involves three steps, 1) measuring stage, 2) measuring discharge, and 3) determining the stage-discharge relationship. Measuring stage involves measuring the current stream height in reference to a constant reference elevation. The stream gauge continuously measures the depth of the river or stream. Second, the gauges measure the amount of discharge from the stream or river. Discharge is the volume of water moving down a stream or river over time, usually measured in cubic feet per second. Lastly, the gauges calculate the relationship between the stage and the discharge to get the overall flow. The data collected from gauges is used by Cities, County Emergency Managers, and other Emergency Response personnel to predict when floods are coming and help determine response methods. The volume of water can also be analyzed with water quality data to determine the nutrient load carried by the water. These gauges are important tools in predicting and measuring UWR flood stages and estimating nutrient loss. They can inform flood protection, minimize flood damage, and save lives and property.
Although the four USGS river gauges are vital, they are also costly for local agencies and partners. Some counties in Iowa are paying $30,000 per year to maintain one USGS river gauge. So although county emergency response personnel may want to add additional gauges on tributaries to the UWR Watershed to better maximize limited resources during future flood events, the cities and counties do not have the funds for additional gauges readily available.
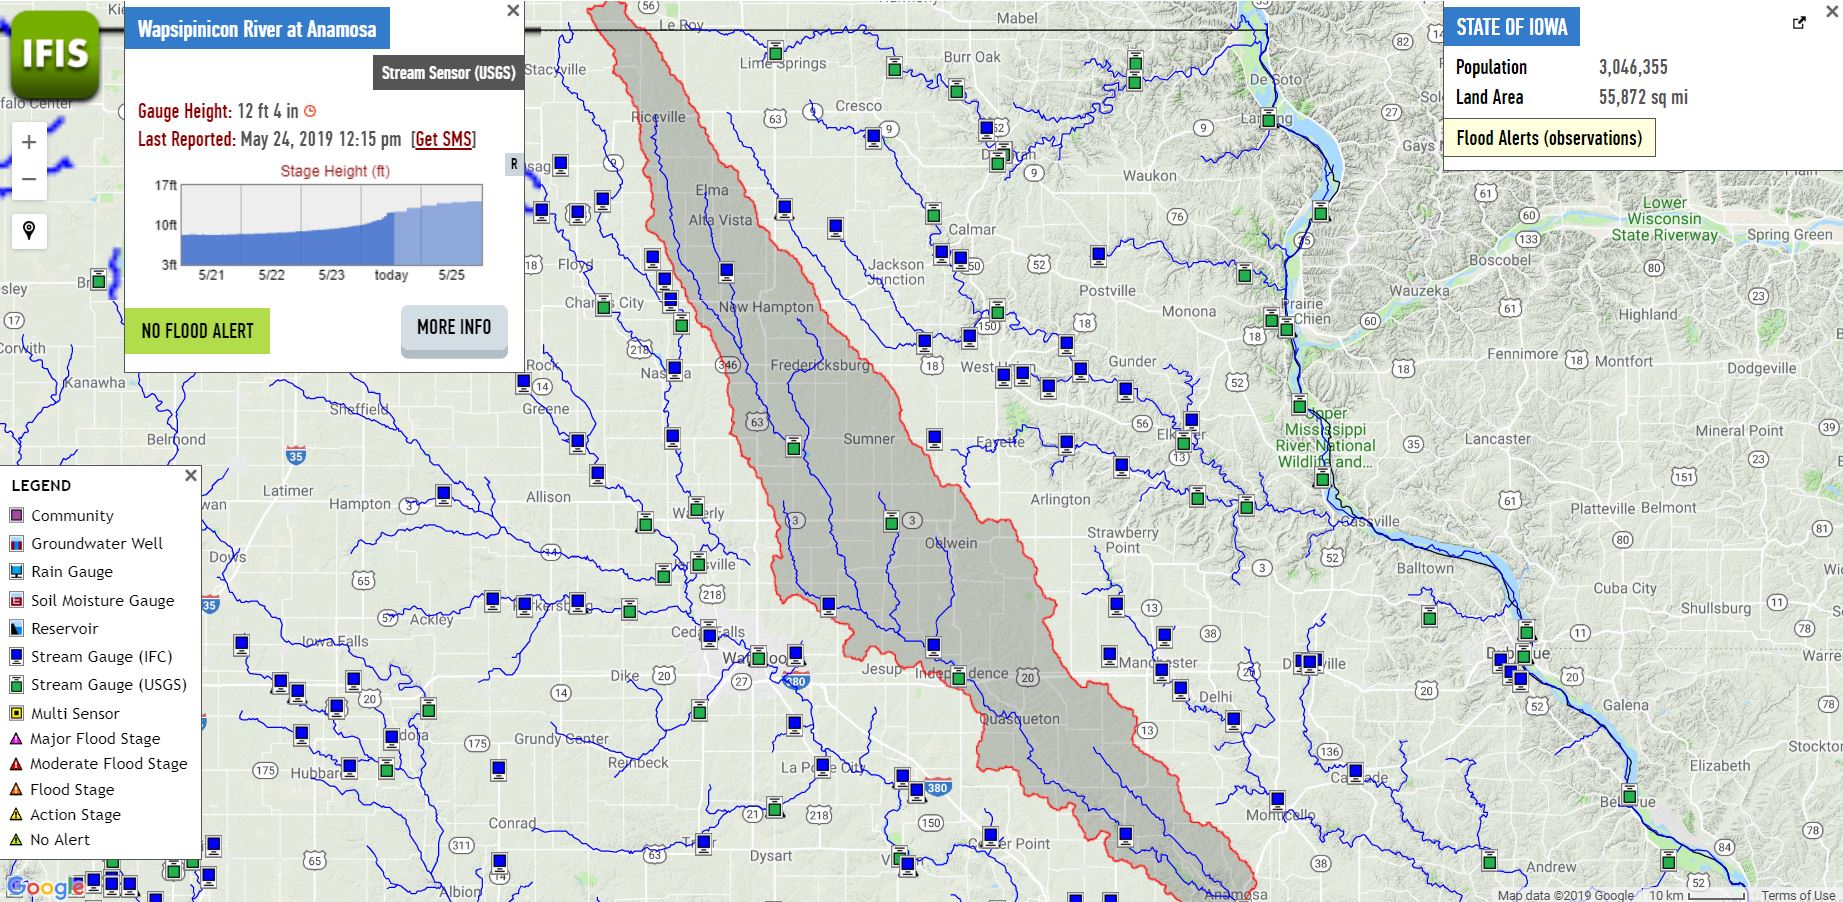
Iowa Flood Center Gauges
The Iowa Flood Center (IFC) developed and maintains an Iowa statewide network of stream stage sensor designed to measure stream height and send data directly to the Iowa Flood Information System (IFIS), which provides public access to the data in real-time. IFC maintains nearly 250 stream stage sensors across the state, including four on the UWR. Locations for these sensors were selected in collaboration with local Emergency Managers, County Engineers, Watershed Management Authorities, City Officials, and other local and state entities. Unlike the USGS monitoring stations, the IFC monitors only measure stream stage, which does not allow for a full analysis of the stream or river during potential flood events but does provide enough information for emergency response personnel to make decisions during a flood event. Because IFC monitors are often less expensive than USGS gaging stations they can be placed more readily throughout the watershed to provide additional information, support and backup for the USGS gaging stations.
Using the USGS gauges in combination with the Iowa Flood Center Gauges provides the best cost benefits and the most accurate flood predictions. The more stream sensor data collected over a wide area of the watershed, the more time emergency responders have to prepare for and respond to a flood event so they can protect lives and property.
Historic Crests of the Upper Wapsipinicon River
Given the size and scale of the UWR Watershed and the Upper Wapsipinicon River, where rain falls on the landscape within the watersheds greatly impacts how, or if, river levels are influenced at any particular site along the river. However, the Anamosa USGS Gauging Station is the furthest downstream gauge and therefore provides the best watershed-wide summary of flooding for the UWR Watershed that is currently available. For example, the 2008 event is listed as the fourth largest crest recorded in Tripoli and the 5th largest in Independence, but the true magnitude of the 2008 event is evident at Anamosa where it was the highest crest ever recorded by almost three feet.
| Near Tripoli | At Independence | At Anamosa |
|---|---|---|
| (1) 18.50 ft on 07/21/1999 | (1) 22.35 ft on 05/18/1999 | (1) 26.18 ft on 06/13/2008 |
| (2) 18.24 ft on 06/09/2008 | (2) 21.11 ft on 07/18/1968 | (2) 23.71 ft on 07/26/2010 |
| (3) 17.26 ft on 07/01/1969 | (3) 20.30 ft on 08/26/1990 | (3) 22.90 ft on 07/21/1968 |
| (4) 17.22 ft on 09/23/2016 | (4) 19.29 ft on 09/25/2016 | (4) 22.76 ft on 09/27/2016 |
| (5) 15.97 ft on 05/23/2004 | (5) 18.86 ft on 06/11/2008 | (5) 22.73 ft on 05/26/2004 |
| (6) 15.88 ft on 07/23/2017 | (6) 18.77 ft on 07/24/2010 | (6) 21.56 ft on 05/31/2013 |
| (7) 15.61 ft on 08/26/2016 | (7) 18.74 ft on 06/14/1947 | (7) 18.96 ft on 07/27/2017 |
| (8) 15.44 ft on 03/14/2010 | (8) 18.20 ft on 04/30/1951 | (8) 18.66 ft on 06/30/2014 |
| (9) 15.04 ft on 09/11/2016 | (9) 18.00 ft on 05/23/2004 | (9) 17.99 ft on 08/27/2009 |
| (10) 14.91 ft on 06/29/1998 | (10) 17.31 ft on 08/30/1979 | (10) 16.22 ft on 08/28/2007 |
Flood Recurrence Intervals
The public sometimes misunderstands the probability that flooding will occur or the commonly used flood recurrence intervals. News media have recognized this in recent years noting the following.
“The concept of the “100-year flood” is one of the most misunderstood terms in disaster preparedness” (fivethirtyeight.com)
“The concept of flood recurrence intervals is a classic example of a communication gap that can form between scientists and the public (winscontext.org).”
“As Earth’s climate changes, extreme floods now described as “100-year” and “500-year” events are expected to become more frequent. So will the number of times that the public gets confused by those labels. Some experts wonder if it might be time to scrap such terminology. So-called 100-year floods are becoming so common that the metric “is pretty much useless now as a baseline for an extreme event,” said Marshall Shepherd, director of the atmospheric sciences program at the University of Georgia and a former president of the American Meteorological Society. “We are in a new normal,” he told HuffPost. (huffingtonpost.com)” https://www.huffingtonpost.com/entry/100-year-flood-climate-change_us_59a6eaa3e4b084581a14ea14
As confusing as the concepts are, flood recurrence intervals are still being used, so it is helpful to understand what is meant when a flood is characterized as a 100-year or 500-year flood. FEMA characterizes flood severity based on the recurrence interval in years, which is characterized by the probability that they will occur in any given year. For example, a ten-year flood event has a 10% chance of happening during any time of the year on any given year, a 100-year flood has a 1% chance of occurring, and a 500-year flood has a .2% chance of occurring at any time during the year. It is also important to understand that, although there is a correlation, the recurrence interval does not indicate the actual force or velocity of the floodwaters for any given occurrence. According to the Iowa Flood Center, higher magnitude flood events are increasing in frequency over the past 50 years due to higher intensity precipitation patterns, which means that the probability of the occurrence of a 500-year flood, as they are currently defined, is higher. Increases in precipitation intensity are predicted to continue to rise from 10-20% over the next 50 years and will likely result in a higher frequency of large magnitude flood events. The table below provides the magnitude of some of the largest floods in the UWR Watershed over the past 20 years. It also shows the speed of flows that correlates with a 25-yr, 50-yr, a 100-yr, and 500-yr flood events.
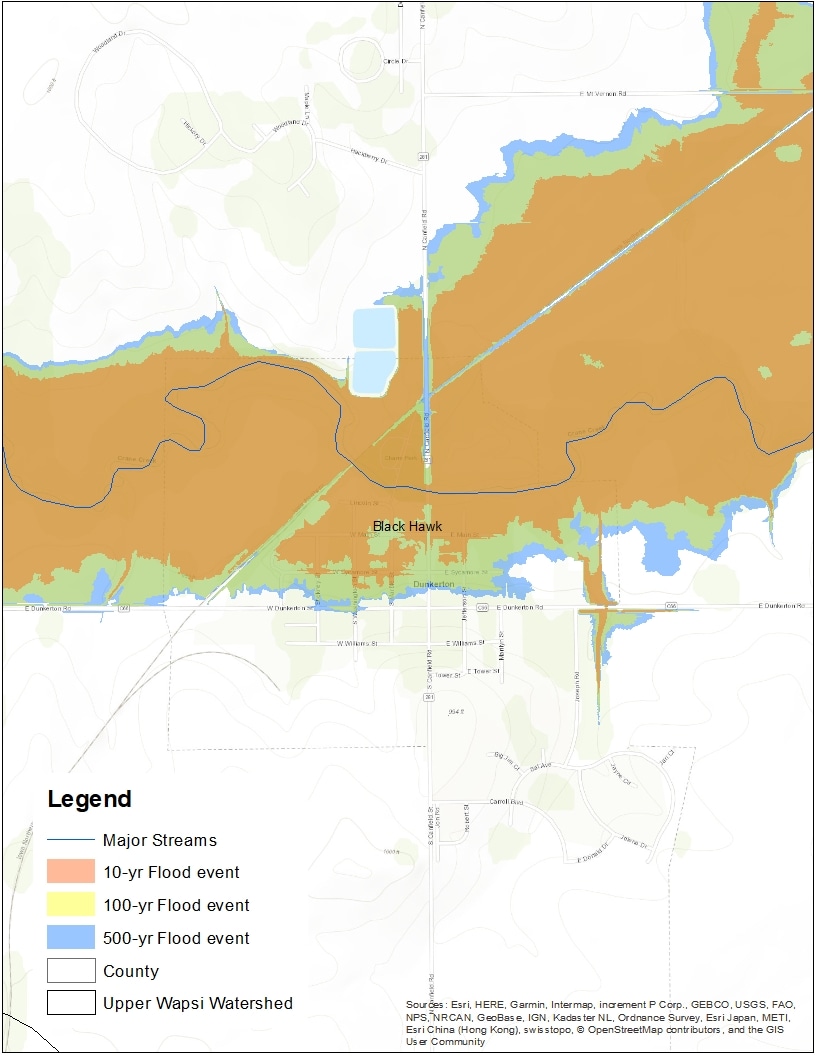
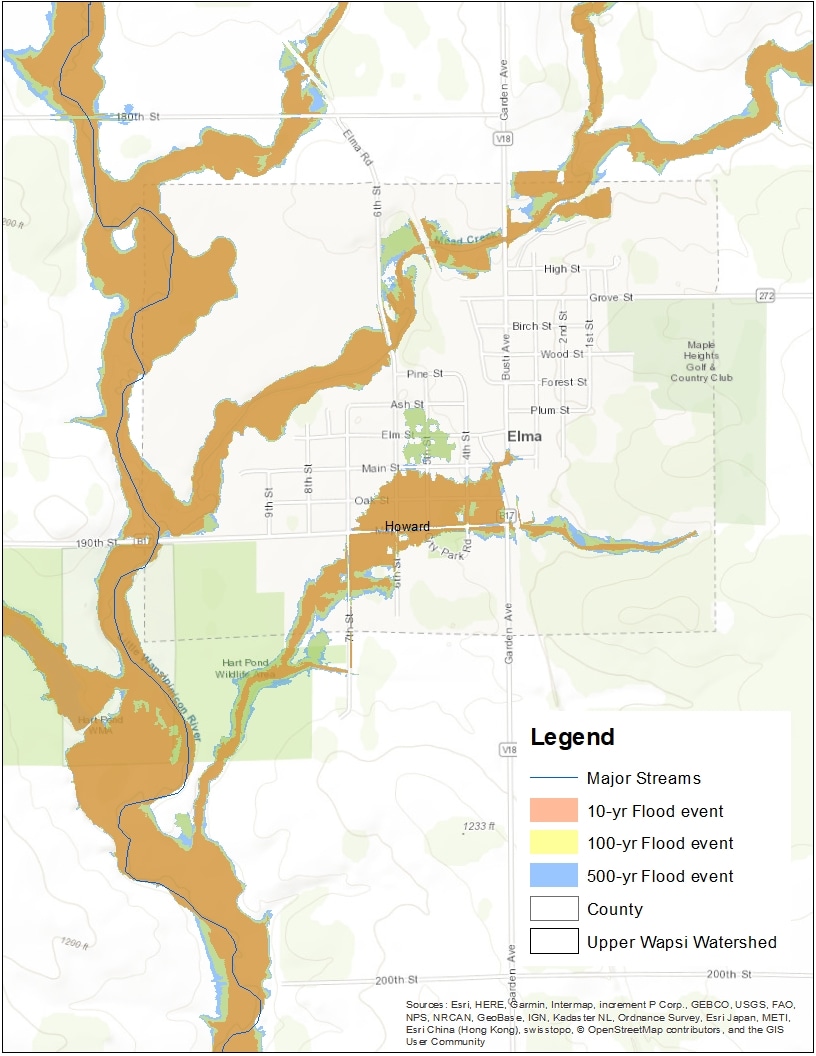
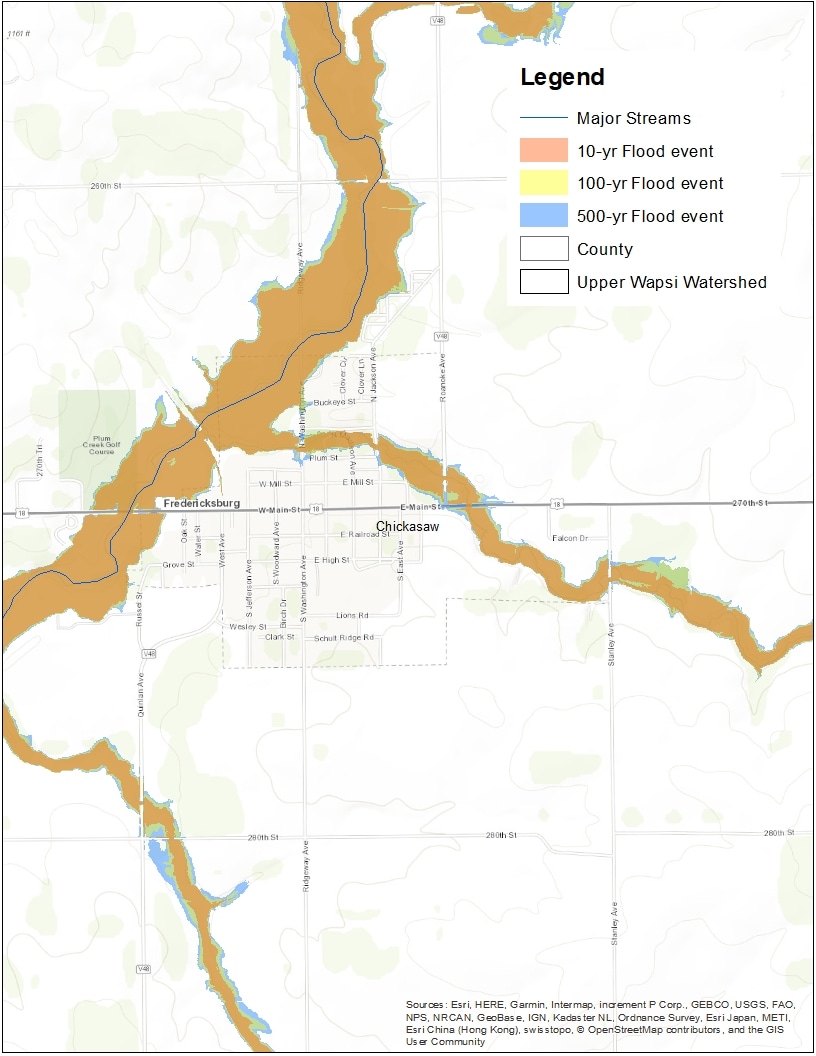
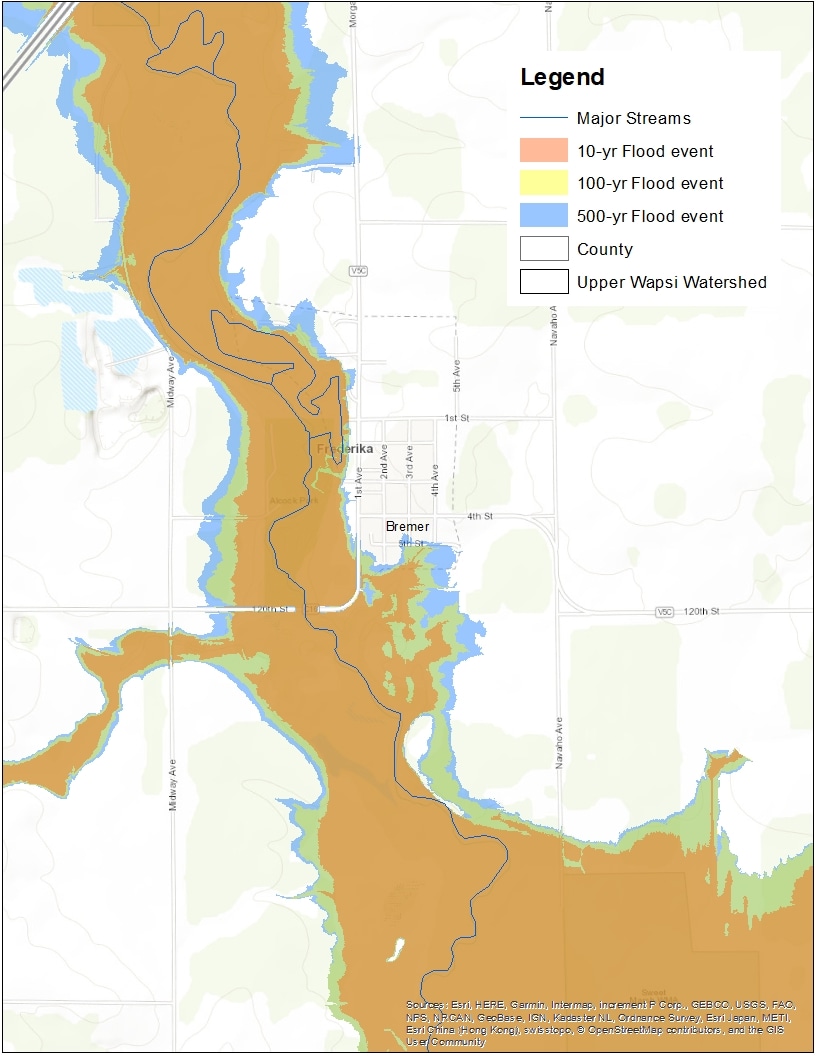
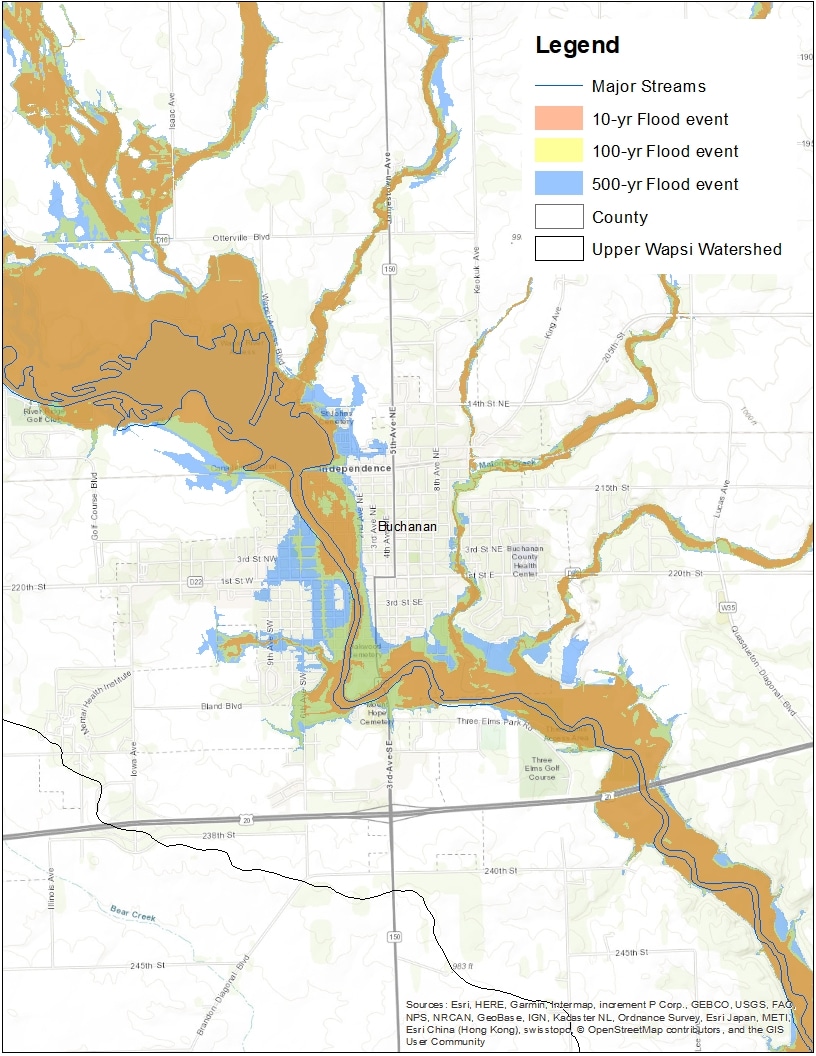
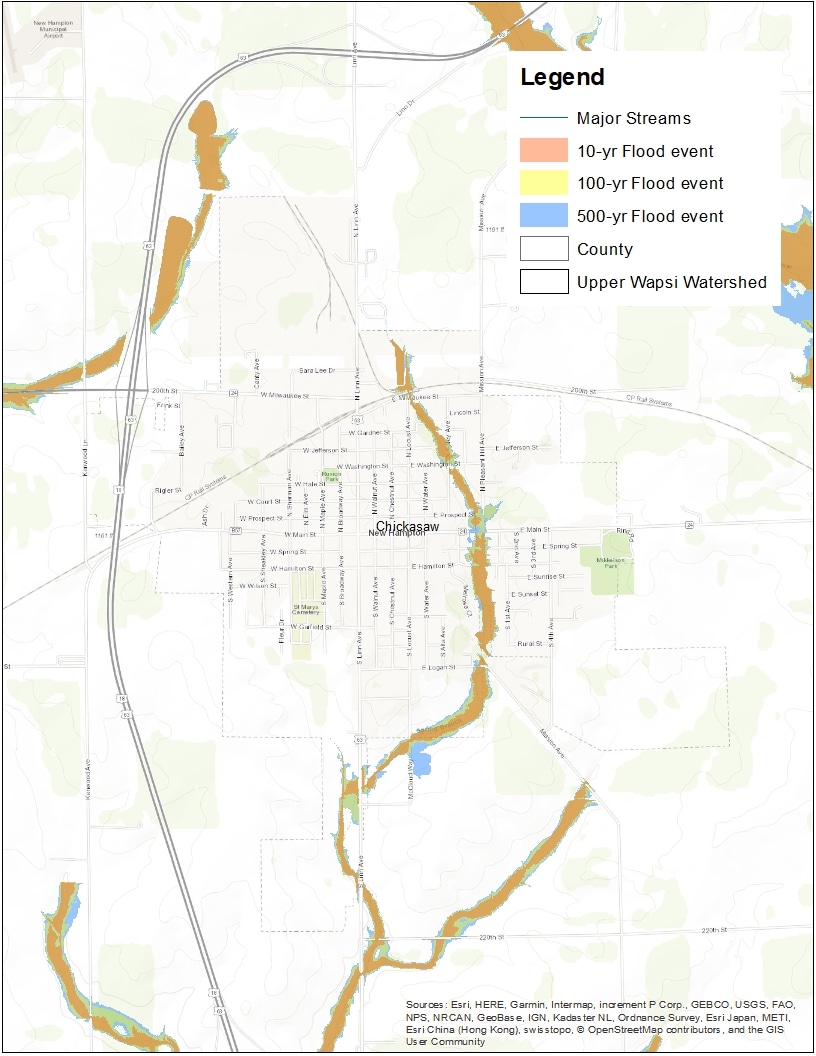
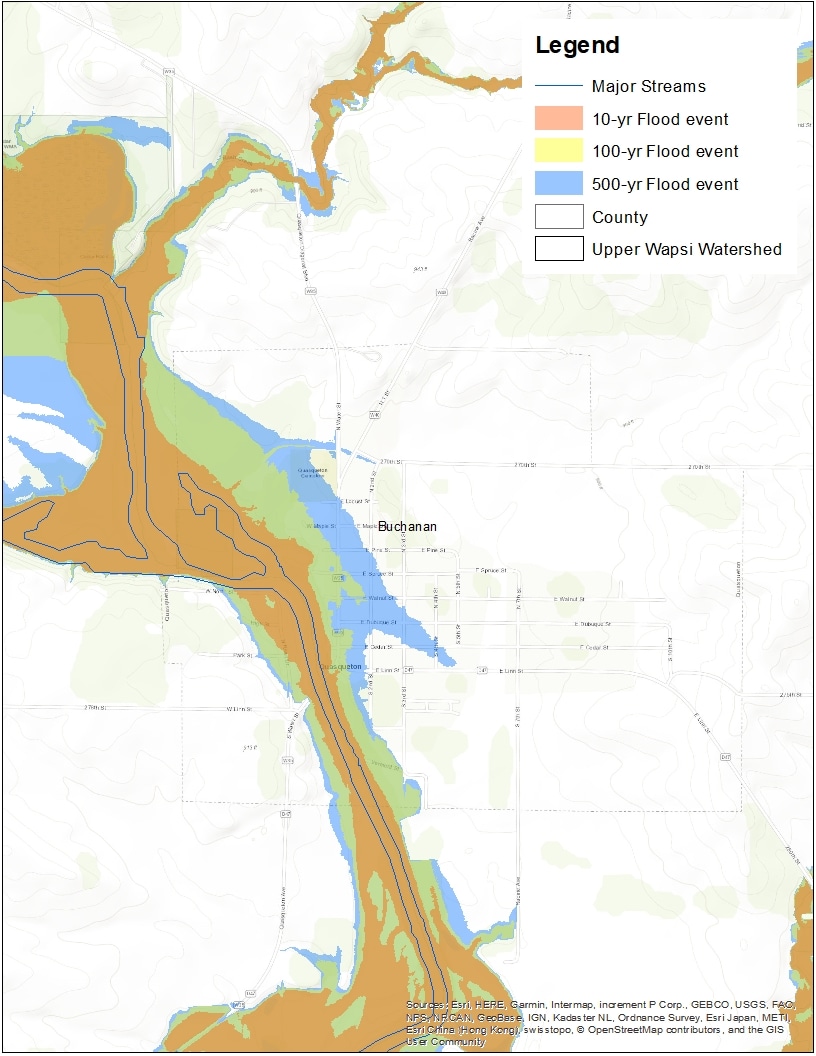
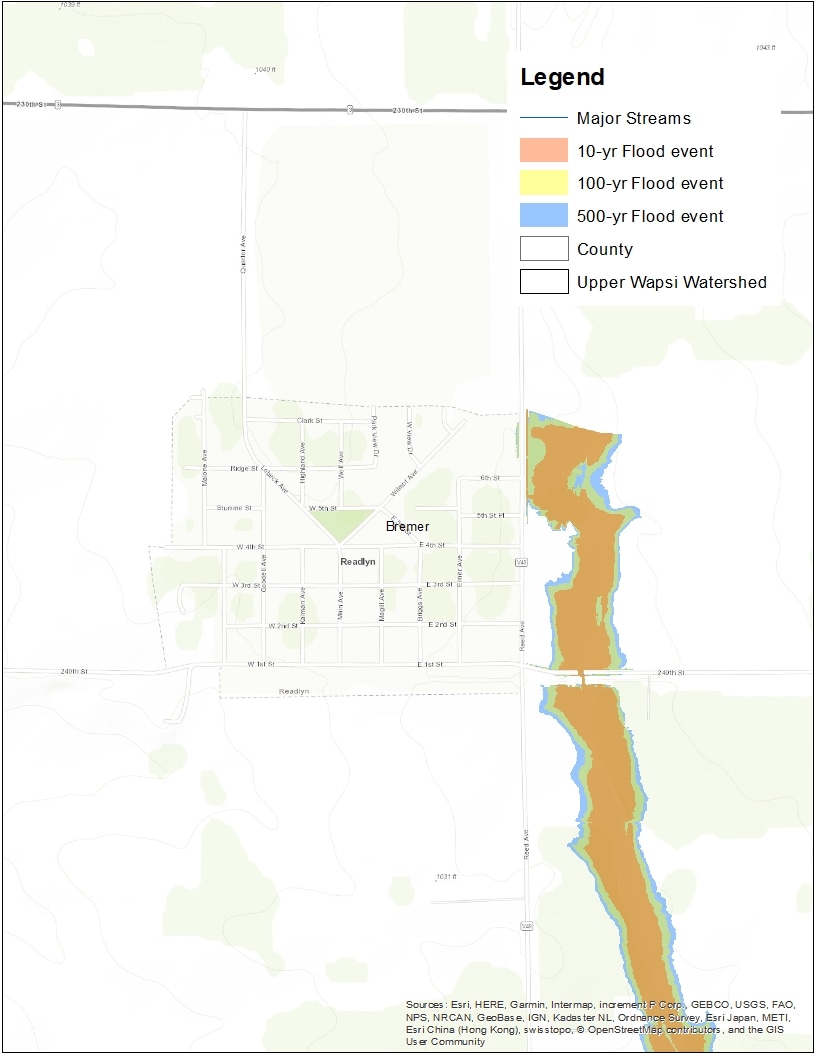
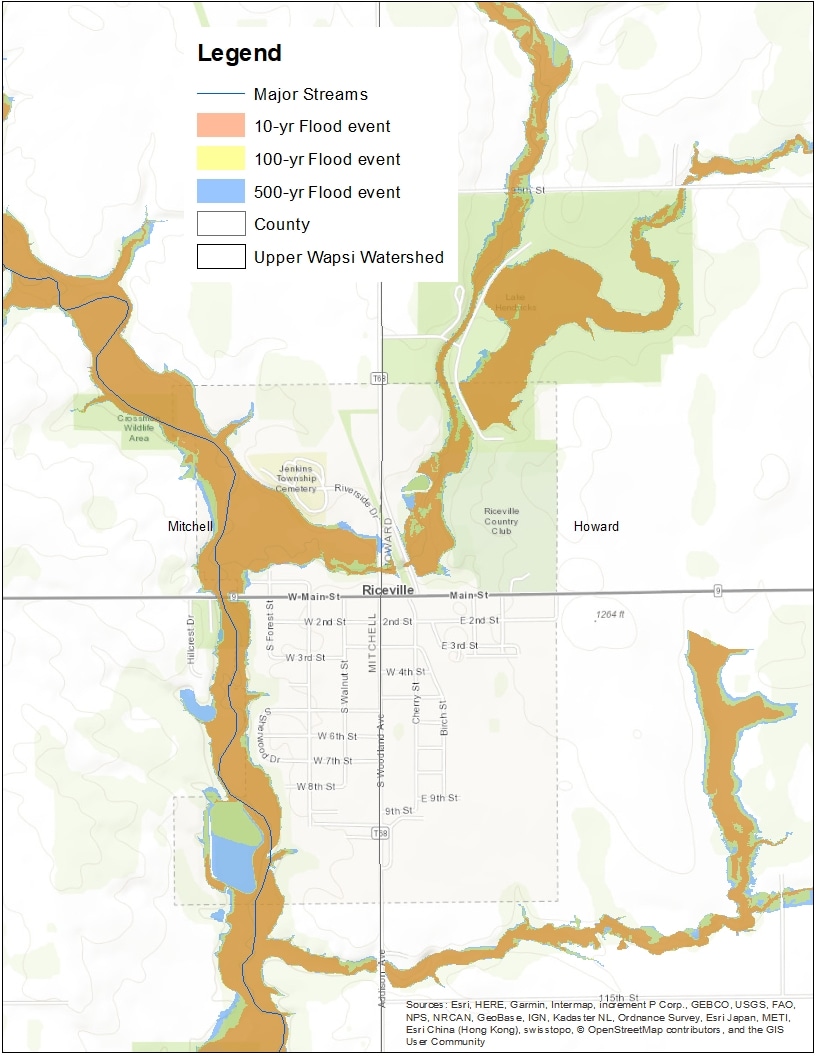
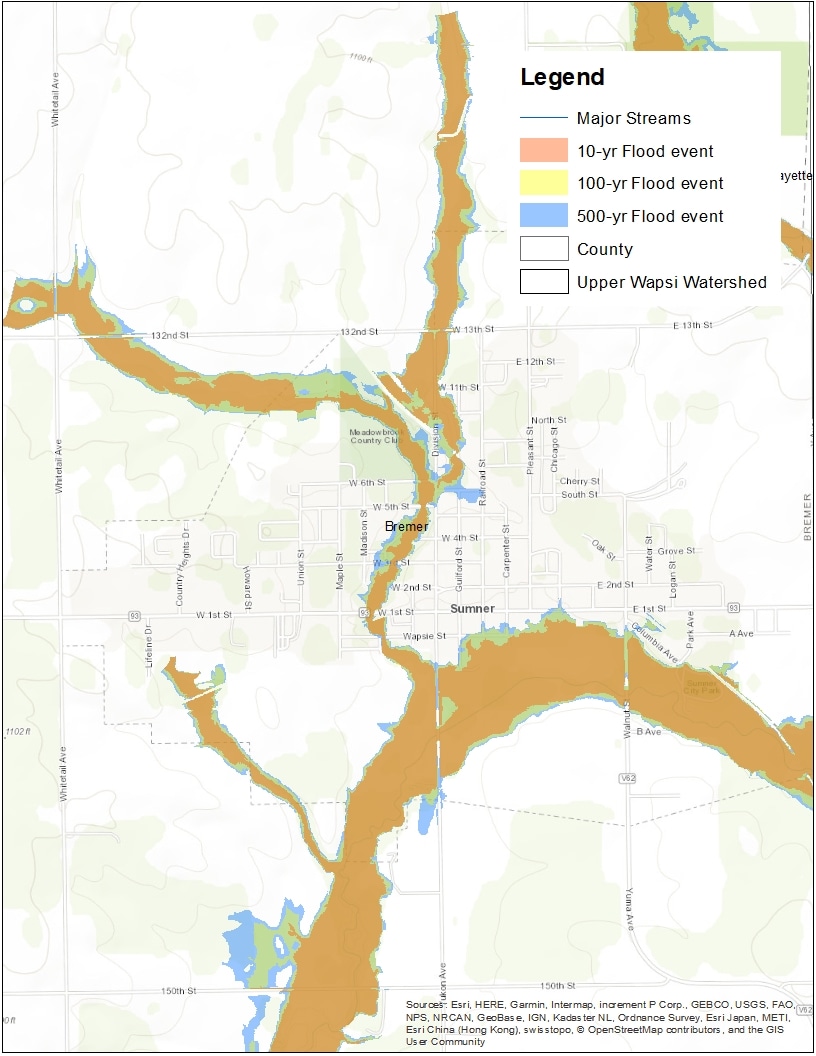
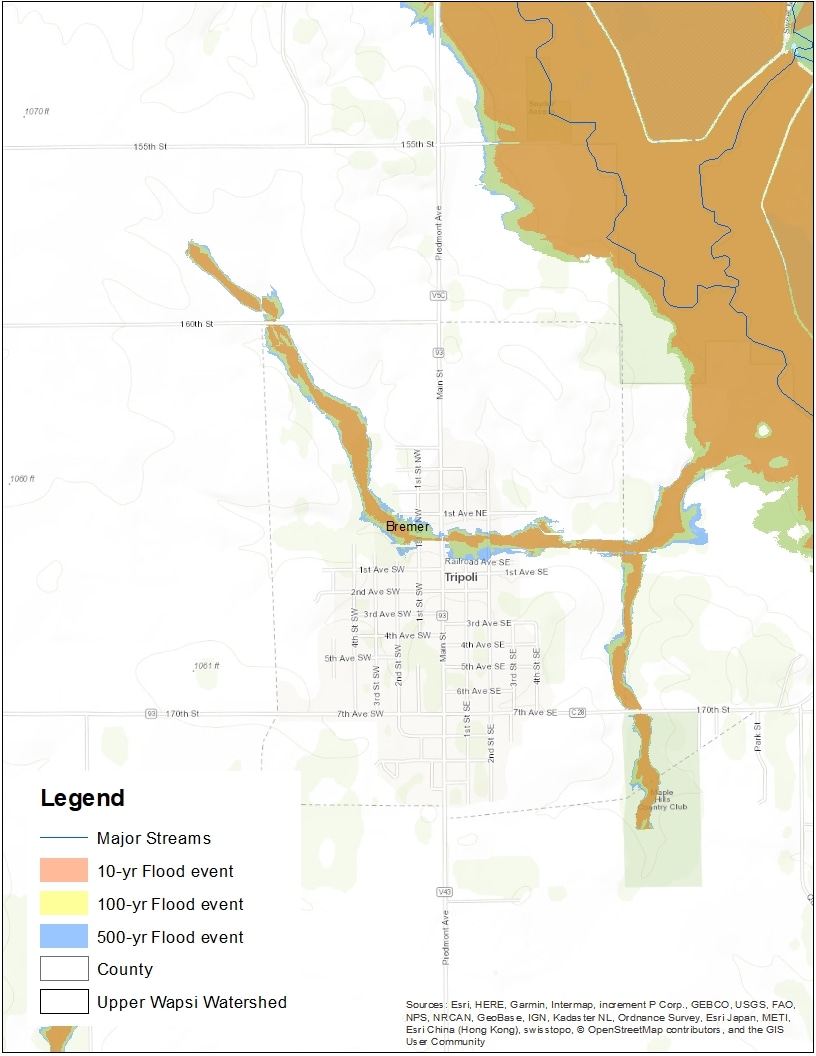
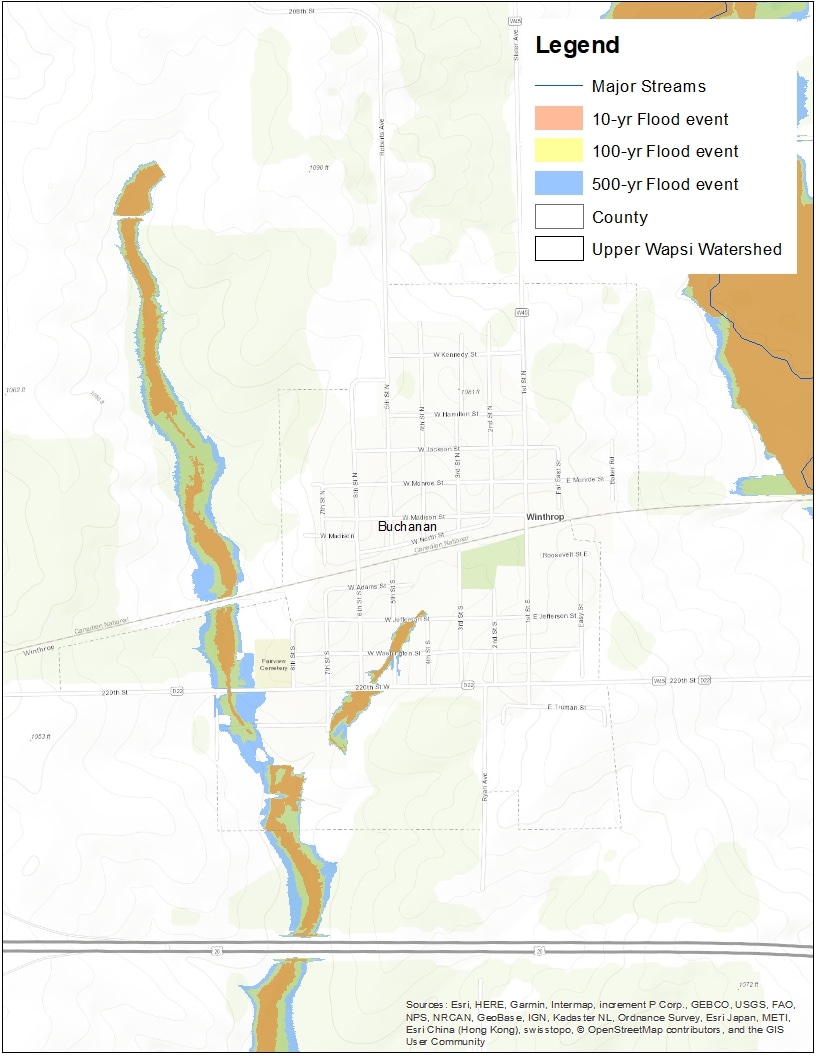
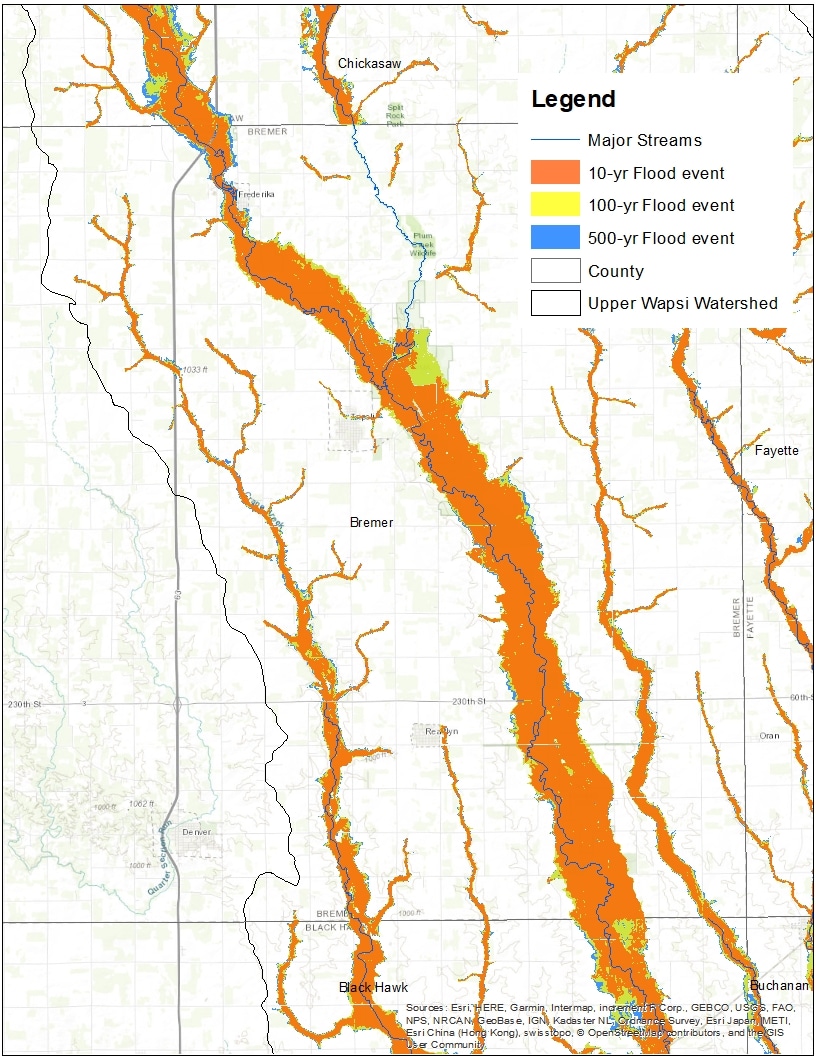
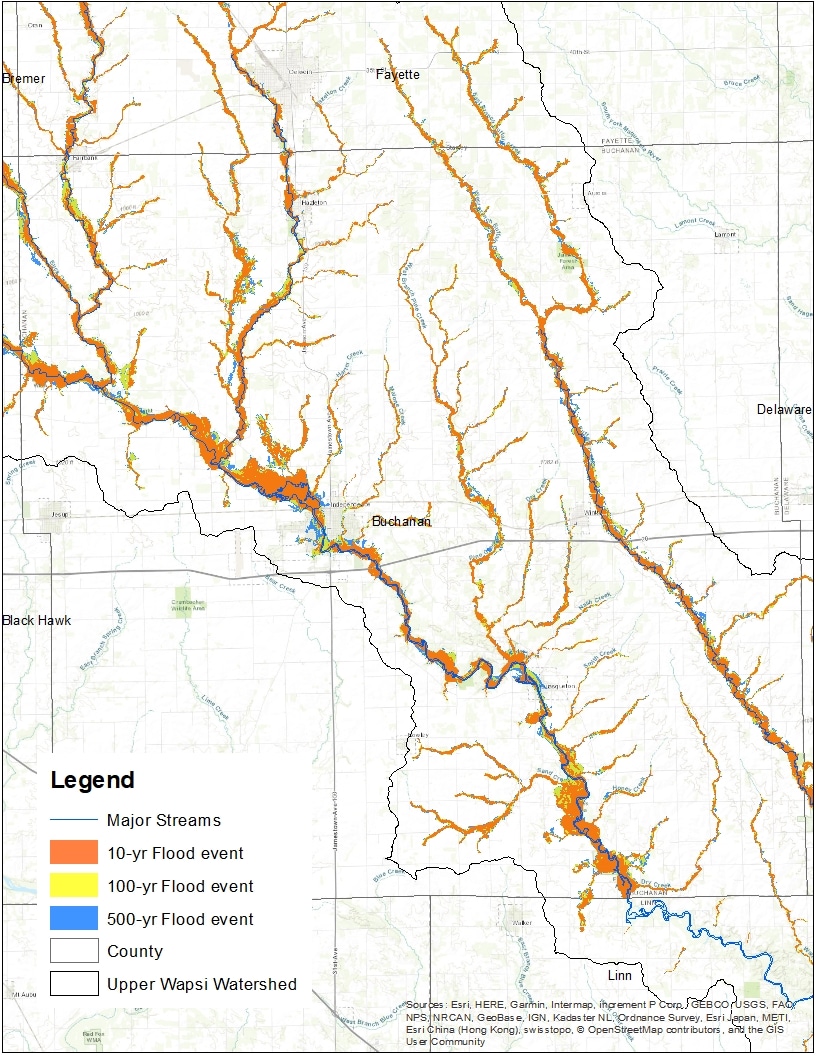
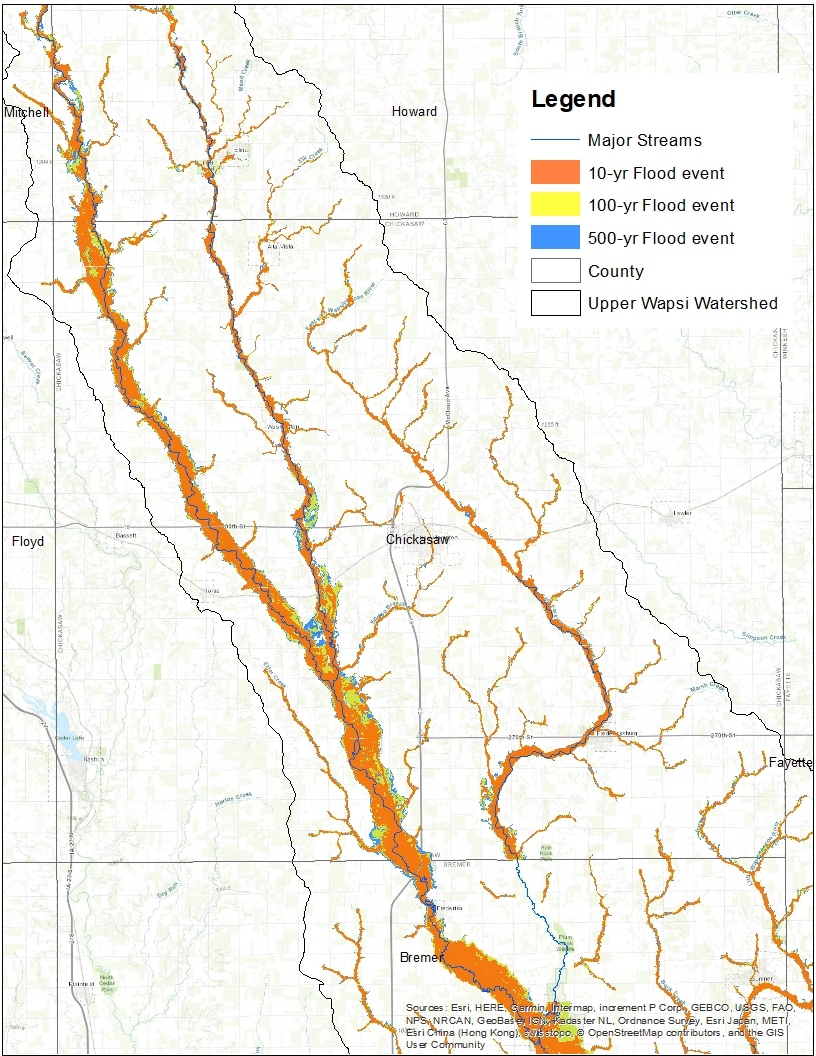
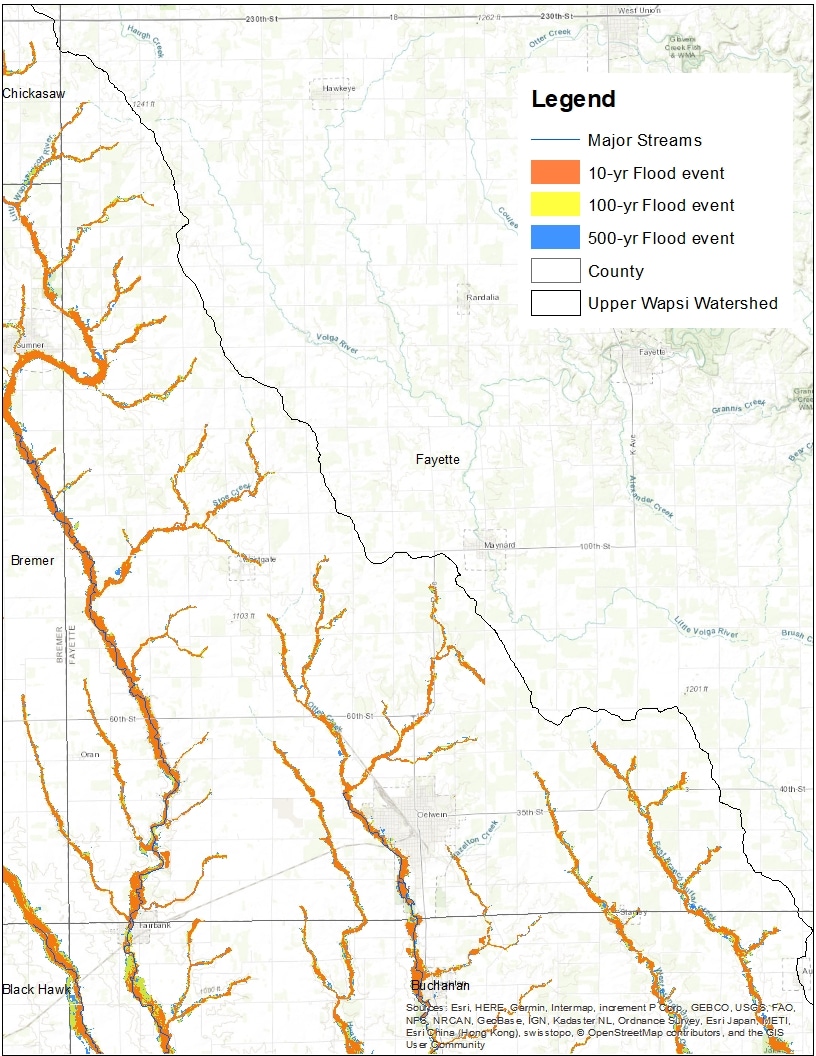
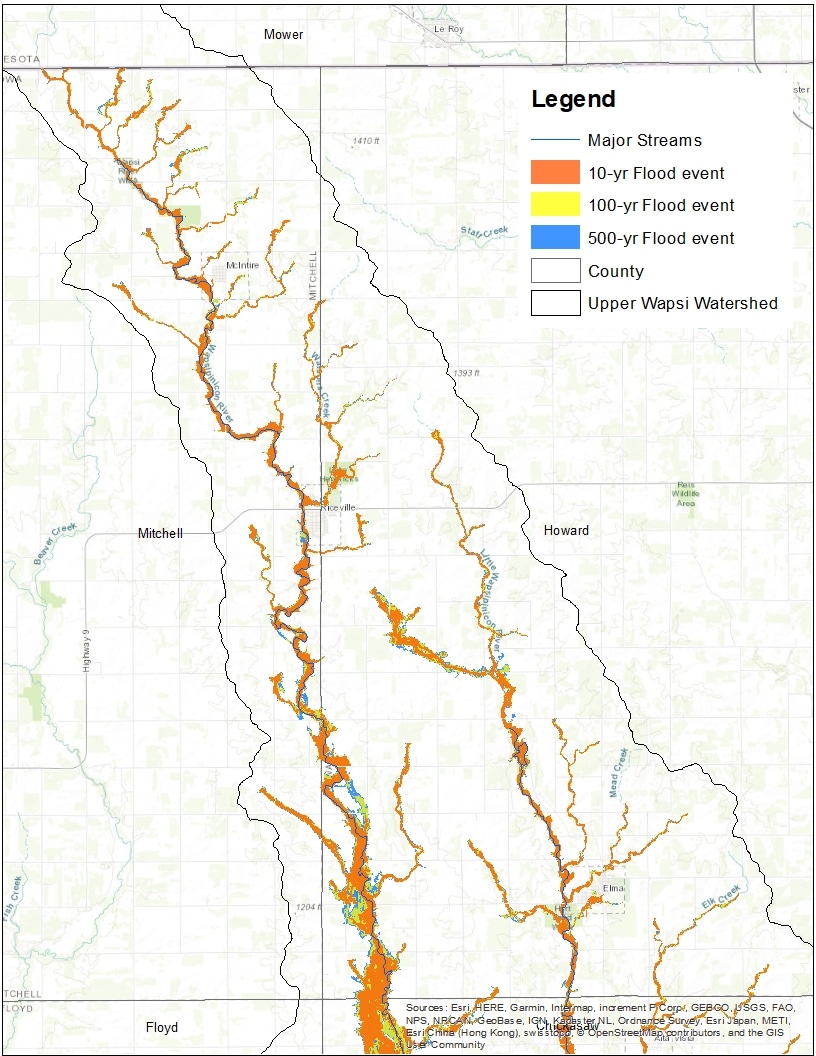
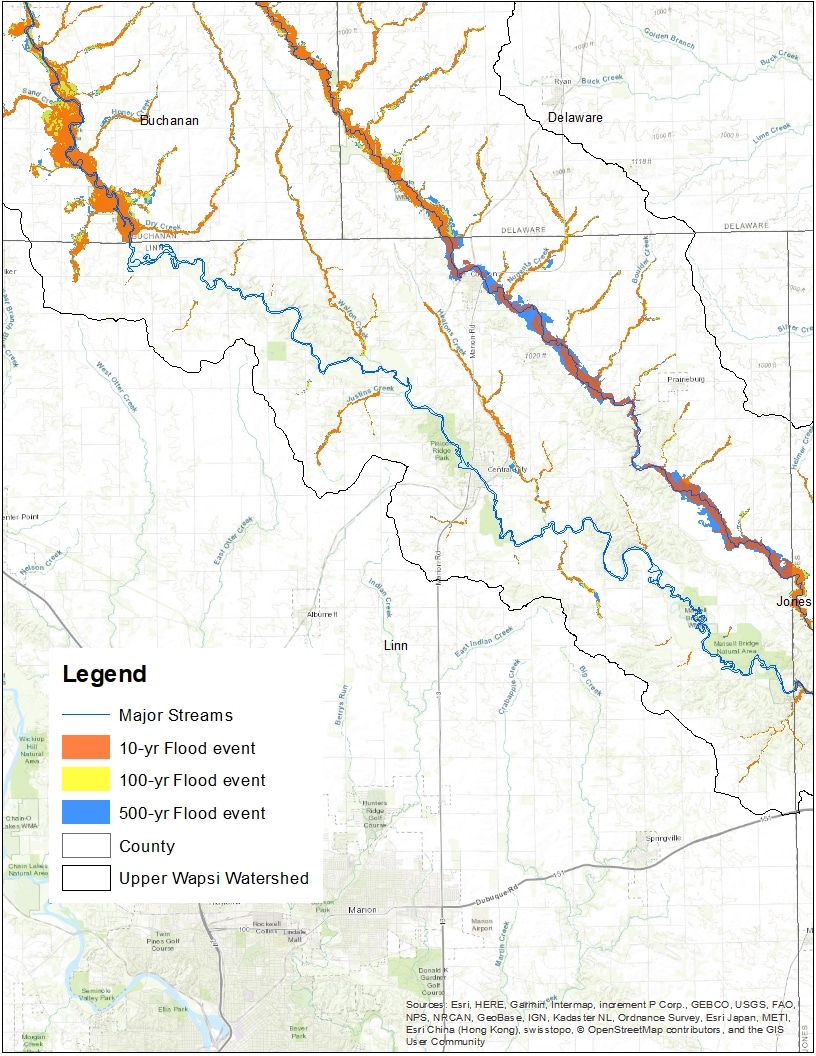
Flood Inundation Maps by WMA Member Jurisdiction
City of Dunkerton, City of Elma, City of Fredericksburg, City of Frederika, City of Hazelton, City of Independence, City of New Hampton, City of Quasqueton, City of Readlyn, City of Riceville, City of Sumner, City of Tripoli, City of Winthrop.
Black Hawk County, Bremer County, Buchanan County, Chickasaw County, Fayette County, Howard County, Linn County, Mitchell County
Summary of Peak stages, streamflows and flood probability estimates for the Upper Wapsipinicon River
| Station Name | Date | Stage (ft) | Streamflow (cfs) | 25-yr flood (estimated cfs) | 50-yr flood (estimated cfs) | 100-yr flow (estimated cfs) | 500-yr flood (estimated cfs) |
|---|---|---|---|---|---|---|---|
| Independence | 5/1999 | 22.35* | 31,100** | 23,900 | 28,800 | 33,700 | 45,400 |
| Independence | 6/2008 | 18.86 | 23,700 | ||||
| Independence | 9/2016 | 19.36 | 25,200 | ||||
| Near Tripoli | 7/1999 | 18.50* | 19,400** | 14,500 | 17,300 | 20,000 | 26,900 |
| Near Tripoli | 6/2008 | 18.24 | 18,300** | ||||
| Near Tripoli | 9/2016 | 17.22 | 14,000 | ||||
| Anamosa | 7/1999 | N/A | N/A | 27,600 | 33,100 | 38,500 | 51,400 |
| Anamosa | 6/2008 | 26.18 | 31.800 | ||||
| Anamosa | 9/2016 | N/A | N/A |
*Gauge record high; **Streamflow above 50 year recurrence
Flooding in the United States Midwest, 2008 Professional Paper 1775 U.S. Department of the Interior U.S. Geological Survey By Robert R. Holmes, Jr., Todd A. Koenig, and Krista A. Karstensen
Major recent flood events in the Upper Wapsi River Watershed
2008

Flooding in the Upper Wapsipinicon River Watershed in 2008 resulted from above-average precipitation in the winter of 2007 and spring of 2008. Five to fifteen inches of rain fell on the UWR Watershed, resulting in major flooding throughout the watershed. The figure below shows the statewide observed precipitation during the month of June.
According to the USGS report Floods of May and June 2008 in Iowa, “Because of the severity of the May and June 2008 flooding, the U.S. Geological Survey, in cooperation with other Federal, State, and local agencies, has summarized the meteorological and hydrological conditions leading to the flooding, compiled flood-peak stages and discharges, and estimated revised flood probabilities for 62 selected stream gauges. Record peak discharges or flood probabilities of 1 percent or smaller (100-year flooding or greater) occurred at more than 60 stream gauge locations, particularly in eastern Iowa.”
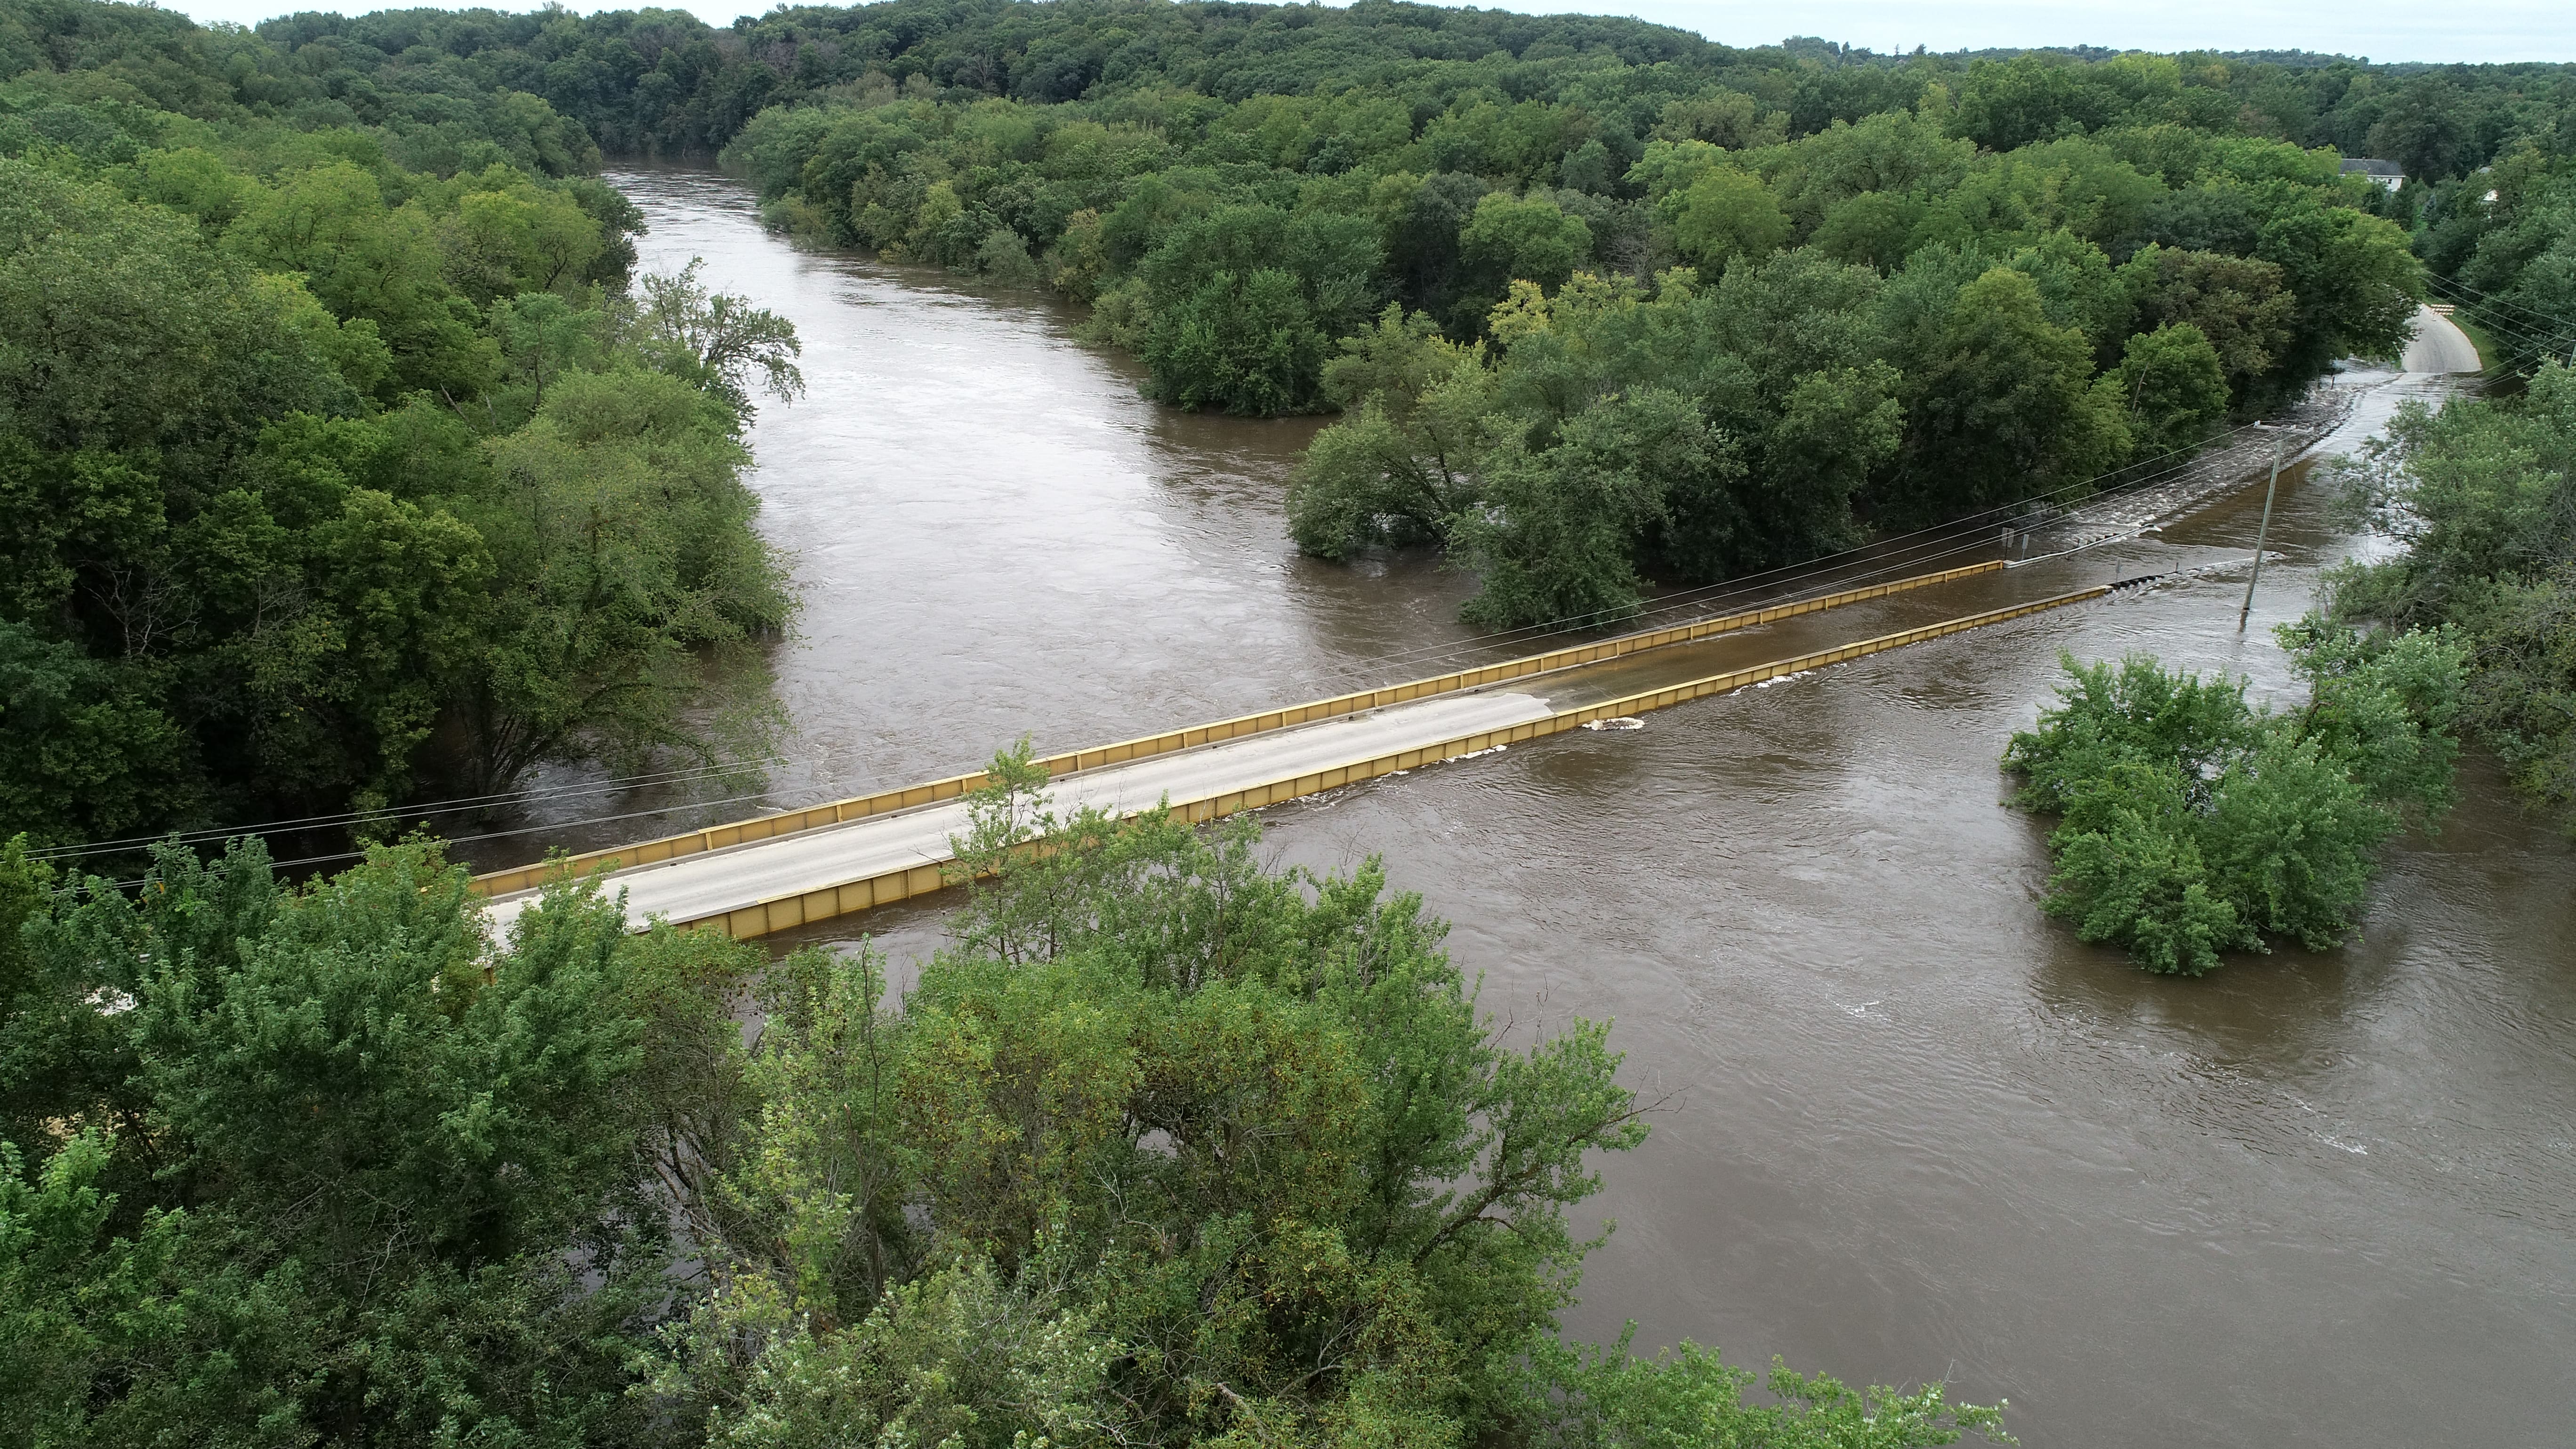
The city of Independence was forced to shut down HWY 150 on the south side of town due to rising waters, trapping residents on both sides of the community. The city of Dunkerton experienced flash flooding from a neighboring Crane Creek.
2016
Heavy rainfall between 5-10 inches fell in September of 2016. Water levels fell just short of the HWY 150 bridge through the City of Independence, but still caused many roads throughout the UWR Watershed to close due to water flowing over roads.