
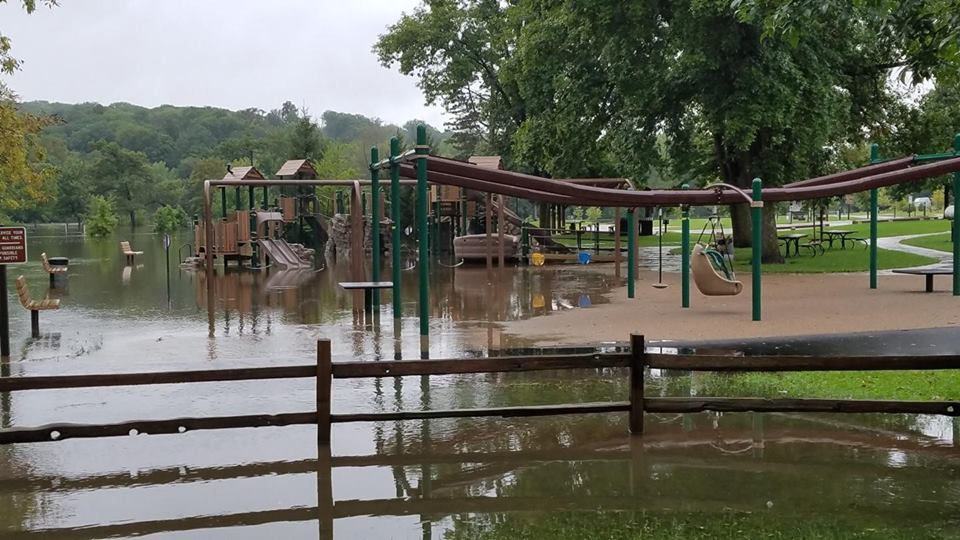
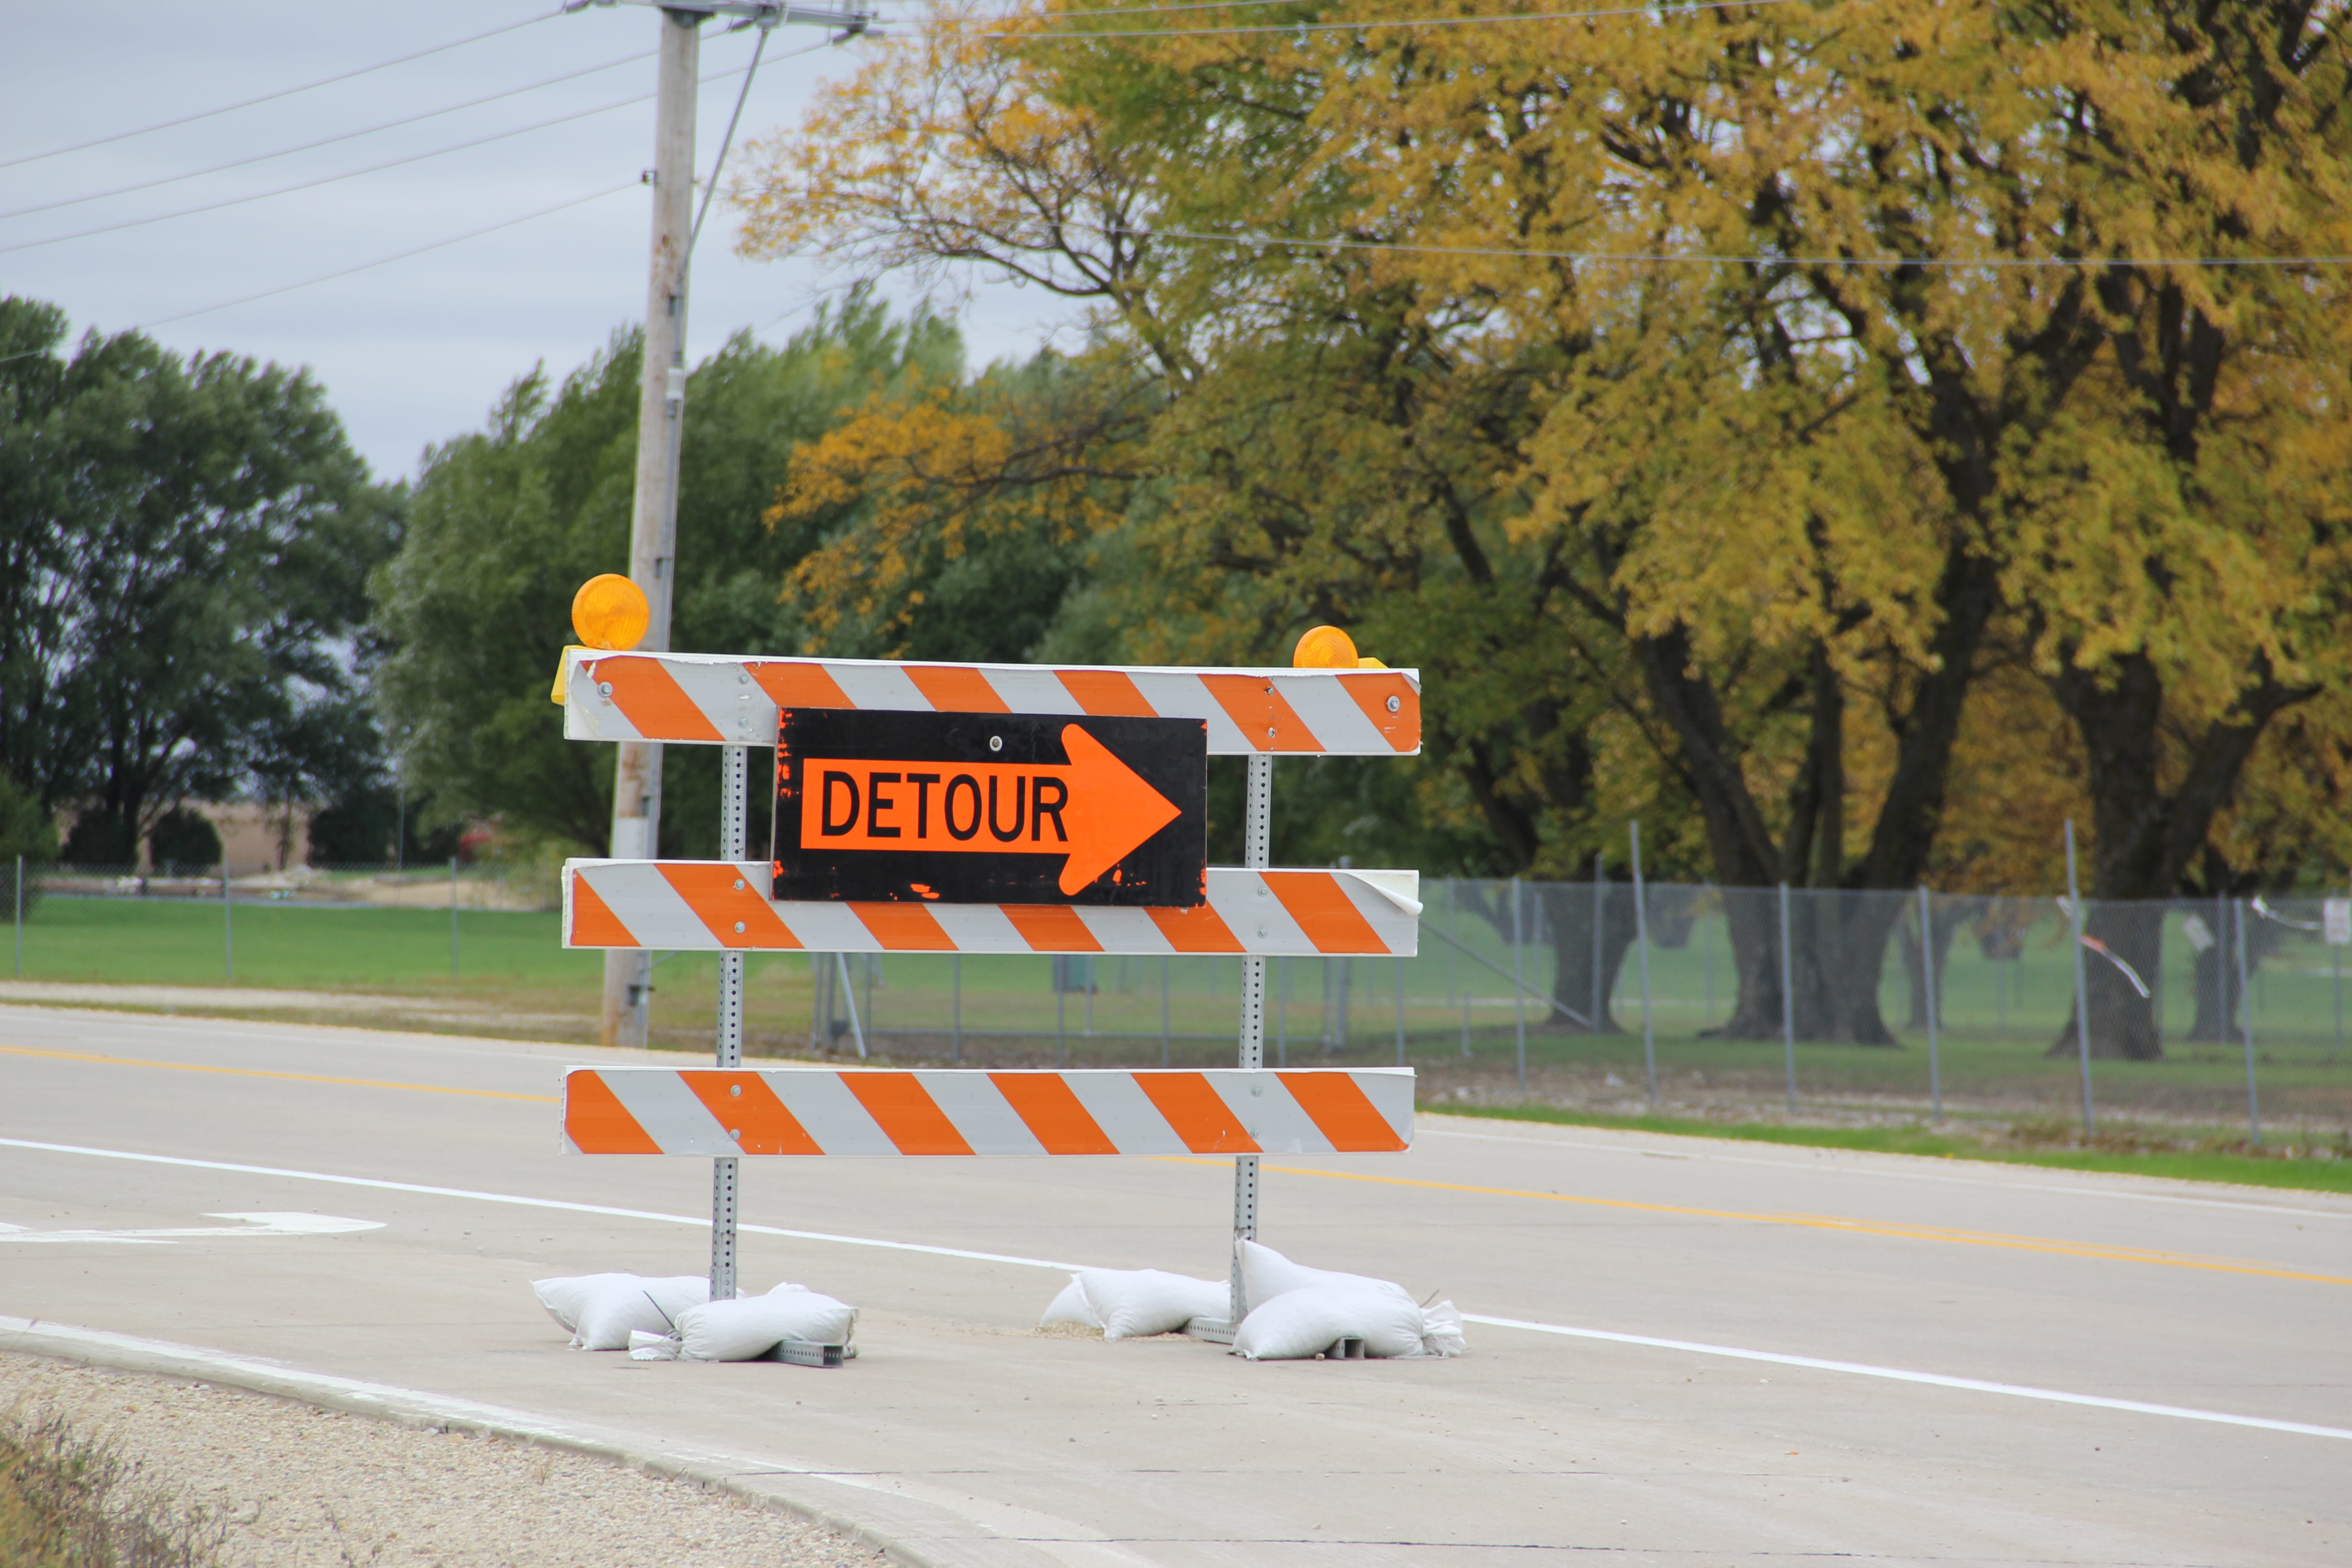
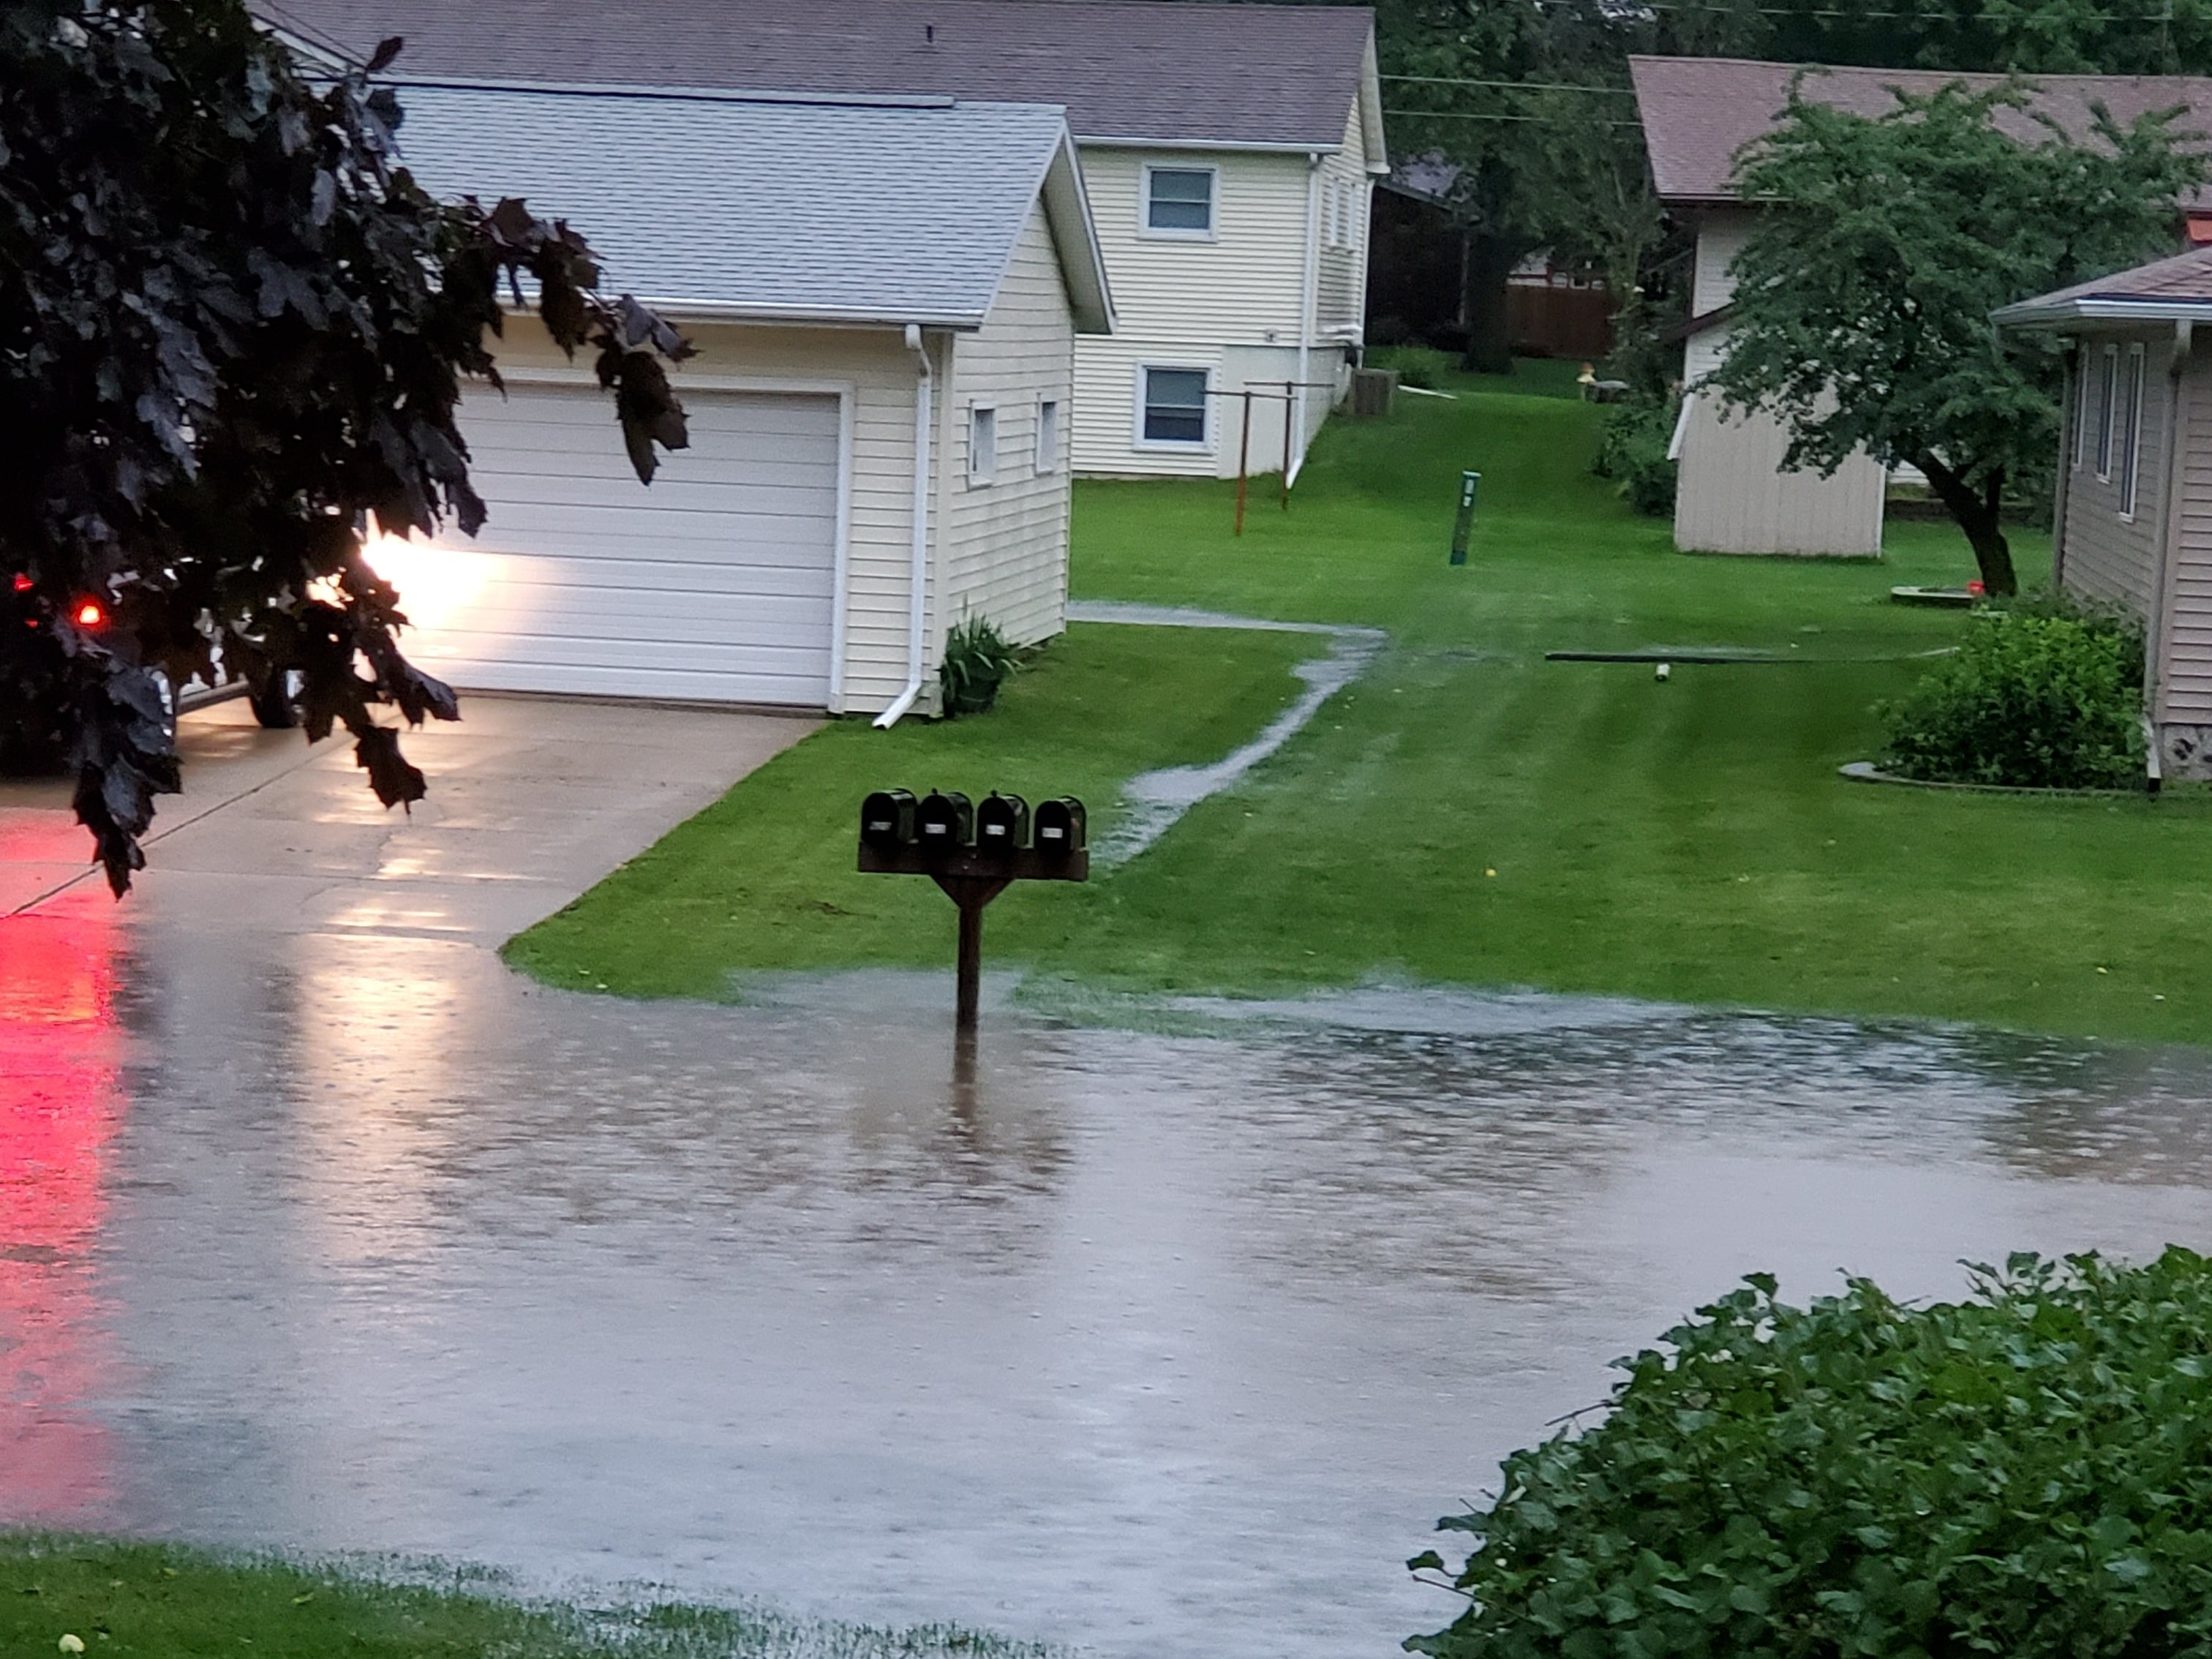
The impact of any individual flood event in the Upper Wapsi River Watershed is dynamic and complicated. It can include loss of life, direct and indirect economic loss and stressors, social, psychological, and cultural impacts, public and private physical infrastructure degradation or loss, property damage or loss, and business loss. The ecological impacts, including water quality degradation, terrestrial and aquatic habitat loss, and soil and nutrient loss and loading, can be significant. Although the time spent on flood prevention and route detours is rarely considered, it also has significant impacts. There are also direct and indirect costs associated with clean up and disposal of flood waste, including damaged private and public infrastructure and debris that has been carried downstream. Some of these impacts can be and are measured or estimated by citizens, municipalities, counties, Iowa or the federal government. Unfortunately, most are never quantified but take a toll on the impacted population. As a result, the total impact of flooding is poorly understood and rarely accurately measured.
Many physical factors influence the total impact of flooding in the UWR Watershed, including soil health, land use, topography, conservation practice location, and even road, culvert and bridge size and placement. Total rainfall quantities and rainfall location, which shifts with every rainfall event, greatly influence impact. Many of these watershed characteristics and other factors are discussed further in the About the Watershed section.
Although the total impact of flooding in the UWR Watershed can’t be predicted for individual events, some information is available that can be used to help us understand why it is essential to increase the resiliency of the UWR Watershed and prevent or reduce the potential for flooding.
Economics of flooding
According to NOAA’s National Centers for Environmental Information, 2017 was the costliest year on record for weather and climate disasters in the United States, but Iowans, including residents of the UWR Watershed have been dealing with the economic impact of flooding for decades.
An analysis of the Federal Emergency Management Agency (FEMA) declarations conducted by the Iowa Flood Center found that Iowa has experienced more federal flood disasters than the majority of other states in the nation. It also found that many of those FEMA declarations were in Eastern Iowa. The State of Iowa ranked fourth in the number of flood-related disaster declarations from 1988-2016.
The Upper Wapsipinicon River Watershed Hydrologic Assessment summarizes some of the costs associated with major flood events in Iowa and shows the numbers of (FEMA) Federal Declarations from Iowa counties due to flooding.
“FEMA records show 952 flood-related disaster declarations (FRDD) in Iowa between 1988 and 2016. Of these, 951 were reported for Iowa counties and one for the Sac and Fox Tribe of the Mississippi in Iowa. All the FRDD in Iowa have been major disaster declarations except the 99 related to Hurricane Katrina evacuation, which were classified as emergency disaster declarations.”


Why are Federal Disaster Declarations Significant?
Federal disaster declarations give impacted regions access to federal recovery assistance. Current regulation permits two kinds of disaster declarations: “Emergency Declarations” and “Major Disaster Declarations” (Stafford Act). Both are granted at the discretion of the president of the United States after the governor of the impacted state makes the request. Federal disaster grants provide assistance for debris removal, emergency protective measures and the repair, replacement, or restoration of disaster-damaged, publicly owned county and state facilities and some private facilities.
The geographic distribution of flood-related Disaster Declarations in Iowa are more frequently focused in the eastern half of the state, including within the UWR Watershed. Each county in the Iowa portion of the UWR Watershed received at least nine flood-related disaster declaration between 1988 and 2016. Although declarations in UWR Watershed counties may have been due to other rivers besides the Wapsipinicon, it is likely that the Disaster Declarations in Bremer, Chickasaw and Buchanan were in response to the Wapsipinicon River. Between 1999 and 2016, Iowans received $1.7 billion dollars in public assistance from flood-related disaster declarations. Iowa was the only landlocked state to receive this high of an amount from federally declared funding (FEMA). In March of 2019, flooding again devastated Iowa, impacting the majority of the state, resulting in over $14 million dollars in federal aid to individuals and public entities, and proving that flooding in Iowa is a local, state and national issue.
Who is FEMA and What Do They Do?
FEMA is the Federal Emergency Management Agency. They coordinate the federal government’s role in disaster mitigation, response, and recovery. In 2008, FEMA’s mission was “To reduce the loss of life and property and protect communities nationwide from all hazards, including natural disasters, acts of terrorism, and other human-made disasters. FEMA leads and supports the nation in a risk-based, comprehensive emergency management system of preparedness, protection, response, recovery, and mitigation.” (FEMA B -653 /July 2008 https://www.fema.gov/pdf/about/brochure.pdf)
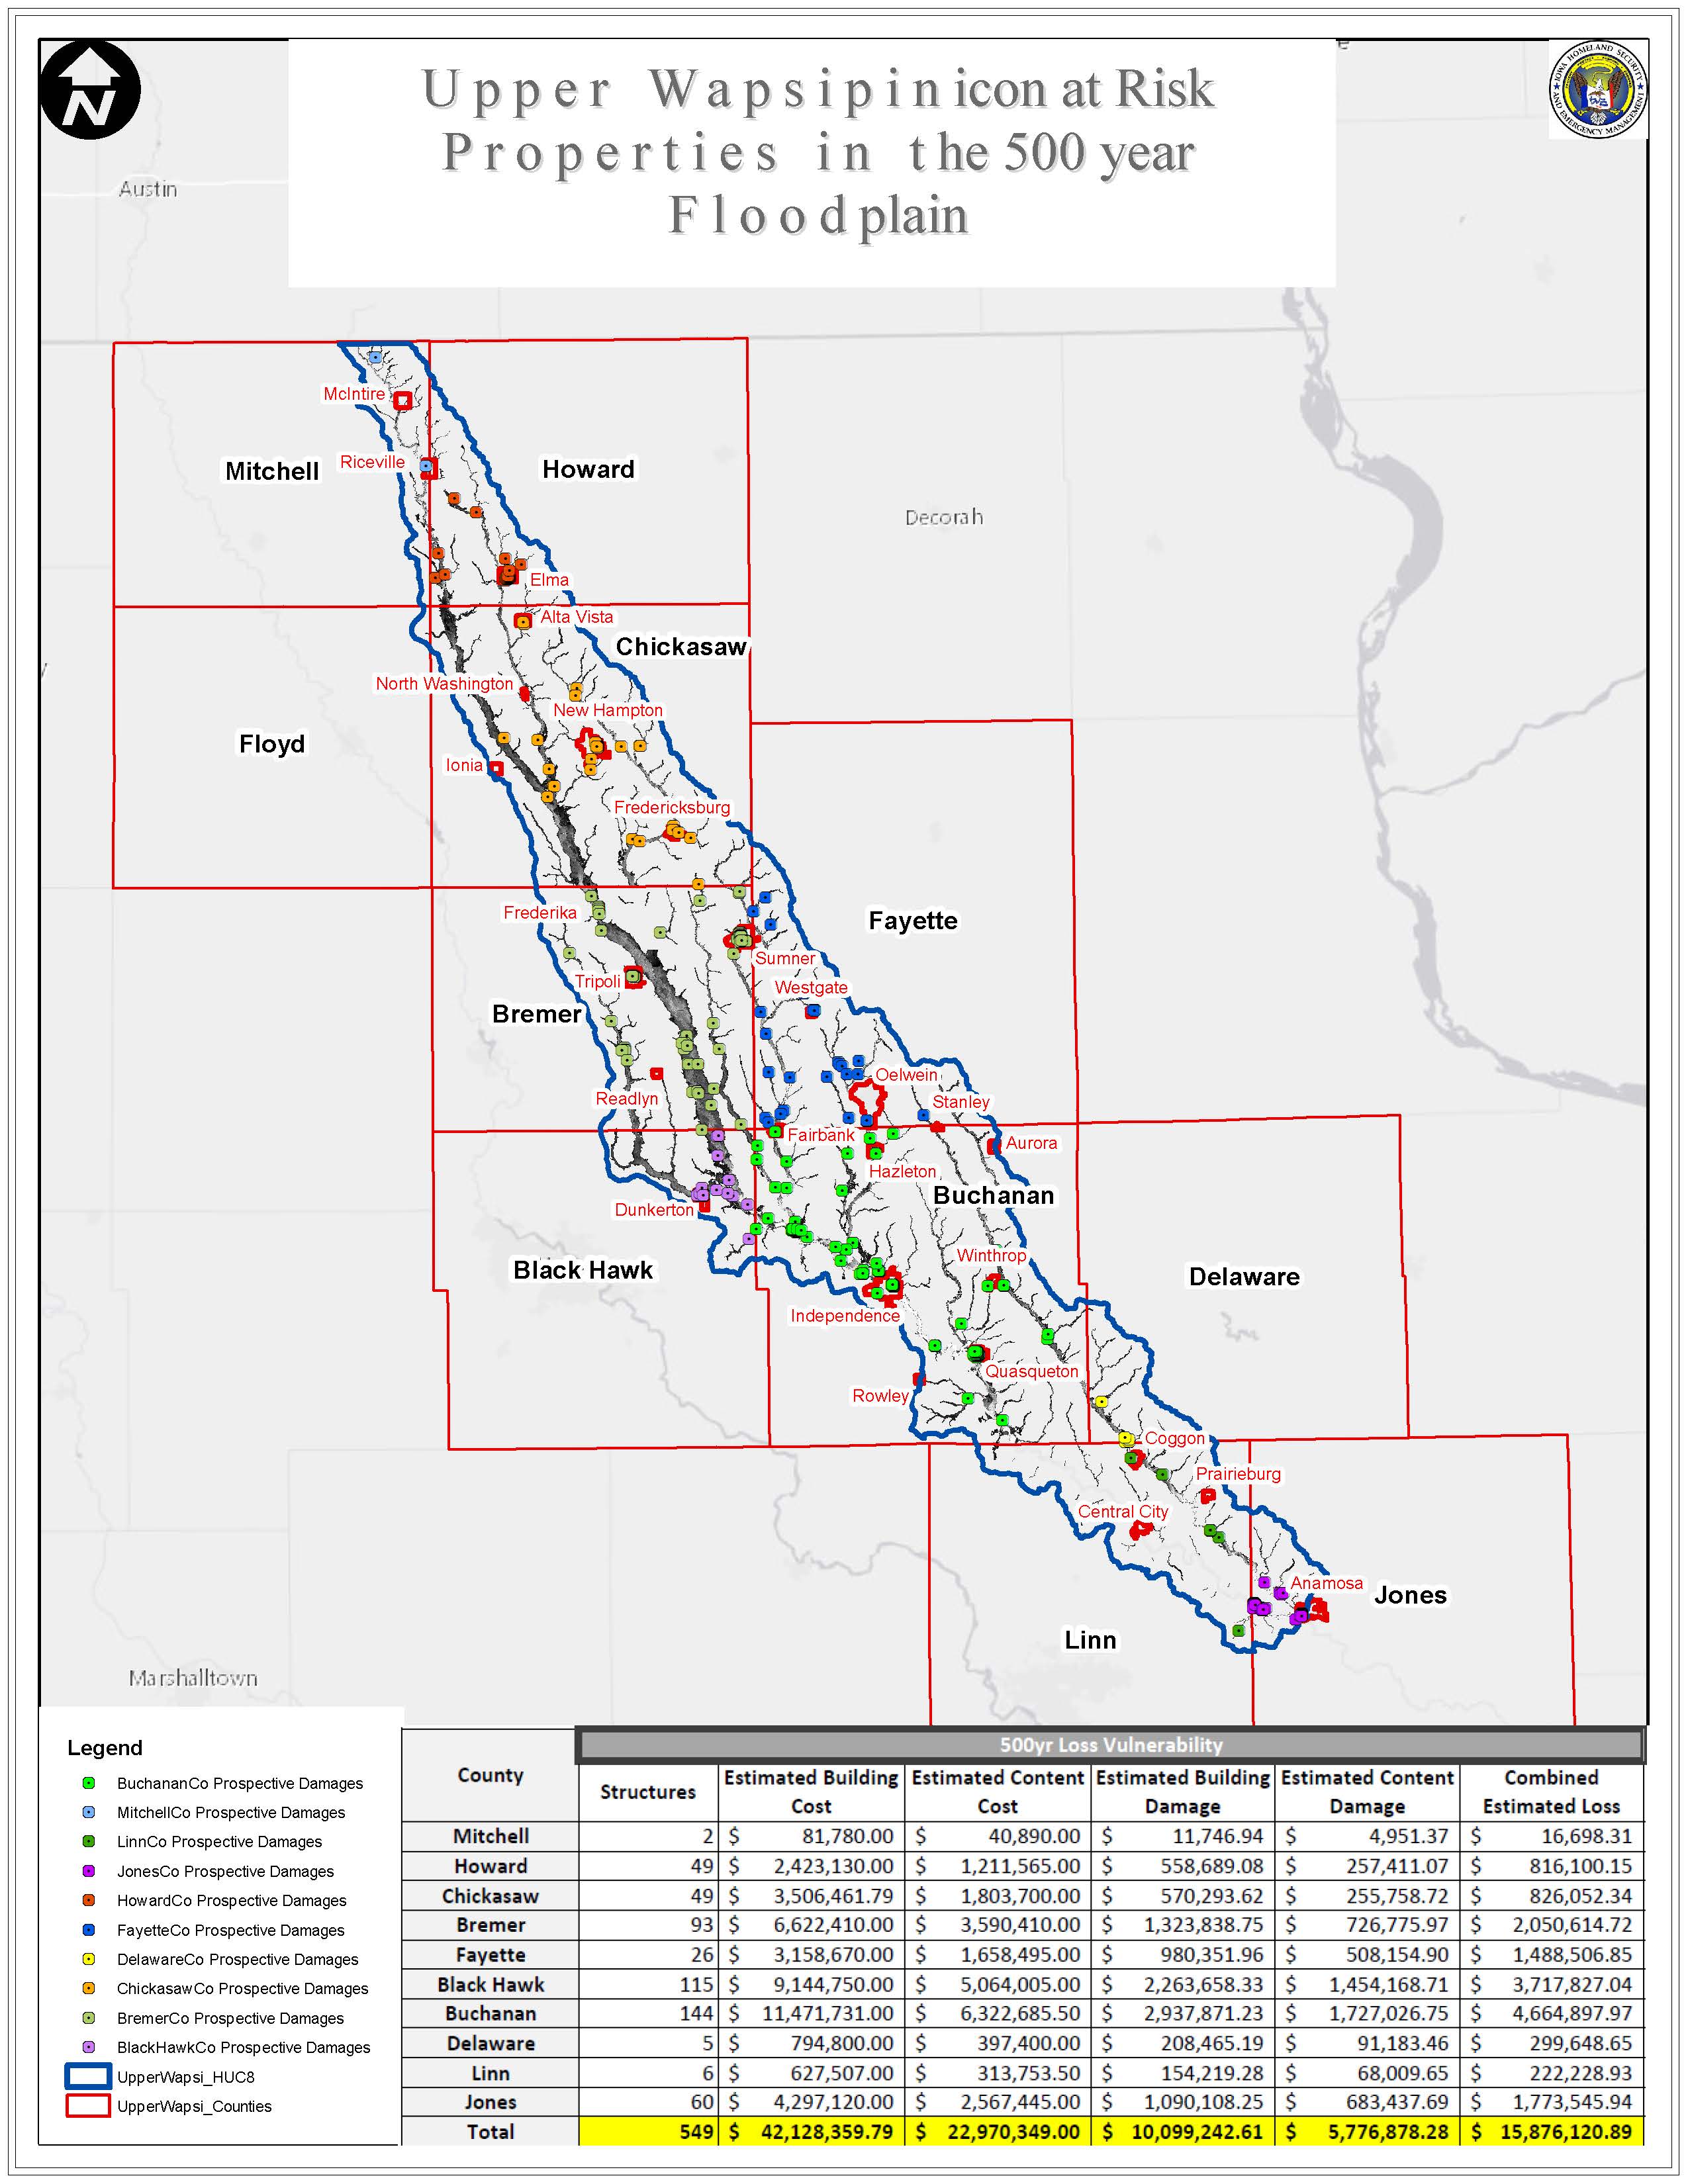
Combined Estimated Loss in the 500 Year Flood
FEMA provides supplemental Federal disaster grant assistance for debris removal, emergency protective measures, and the repair, replacement, or restoration of disaster-damaged, publicly owned facilities and some private facilities. Unfortunately, local government and partners report the FEMA processes and payments can be complicated, time-consuming, limited, and slow or difficult to see through to completion. Today FEMA’s mission is “Helping people before, during, and after disasters” and local partners are hopeful that future FEMA assistance will reflect their new mission and recent trends to reduce the impact of flooding through preventative action rather than only respond to the impact of flooding after the damage has already occurred. The FEMA HAZUS program models potential economic losses from flooding. According to data extracted from the HAZUS model, the combined estimated loss from damage to residential and commercial buildings, and infrastructure in the Upper Wapsipinicon River Watershed during a 500-year flood is $15,876,120. The map and table summarize the economic losses by each county in the UWR Watershed.
FEMA data is linked to declared events only. Property and crop damage reported to and through FEMA are estimated to be a fraction of the actual costs incurred in these counties from flooding. Some costs associated with flooding cannot be, or are not, measured. County FEMA dollars spent on public infrastructure repair and property buyouts to convert private properties to public lands does not count loss of life, private expenditures on flood clean up, private homeowner or business property restorations, loss of business income or businesses, loss of work income, health impacts of flooding, or increased travel costs associated with reroutes or bridge or road closure, community population loss, or loss of tax revenue – including sales and property taxes.
How Does the Iowa Flood Center Help Communities Understand the Economic Impact of Flood Events?
The Iowa Flood Center developed the Iowa Watershed Approach Information System (IWIS), which is an online interactive mapping system that summarizes potential damage estimates for the City of Independence and other communities. According to the IWIS, during a 100-yr flood event, the City of Independence will experience a total of $2,410,743 in structural damage alone. Note: Building cost data used in the IWIS tool is different from the data used in the FEMA HAZUS analysis explained above. IWIS provides a more general summary based on census tract data within the specific community.
To navigate to the IWIS system and to view the City of Independence scenario for a 500-year flood, follow the link and directions below.
- Click the following link to access the IWIS interactive map system for the City of Independence: https://iwa.iowawis.org/app/?mid=592&par=15*42.468359*-91.882968*false*false*false*false*false*false*false*false*false*false*false&snapshot=1
- Adjust the flood map controller slider until the stage reaches 29 ft. (500yr flood stage)
- Select the damage estimate at the bottom of the info panel to view buildings damages by a 500 yr flood!
- Select different stage scenarios to explore how the estimated cost damage changes.
Expectations for Future Economic Impact
Once the public and all the partners better understand the past and projected impacts of flooding, they can better realize the value of investing time and money in flood mitigation measures and strategies.
The National Institute of Building Sciences issued a report on the value of mitigation in January of 2018. The ongoing study found that there are measures that governments, building owners, developers, tenants, and others can take to reduce the impacts of flood events. They estimate that investment in mitigation can save $6 in future disaster costs for every $1 spent on hazard mitigation. The report can be found here. https://www.nibs.org/news/381874/National-Institute-of-Building-Sciences-Issues-New-Report-on-the-Value-of-Mitigation.htm
The UWRW Hydrologic Assessment draws attention to the upward trends associated with soil moisture and intensity of rainfall in the watershed. The Iowa Flood Center also presented information regarding the increase in precipitation over the past few years to the public at a WMA Board meeting, noting that 2018 was the wettest year on record in the watershed and snow accumulation was exceptional in the winter of 2018/2019, saturating the ground.
Impacts to County Public Infrastructure
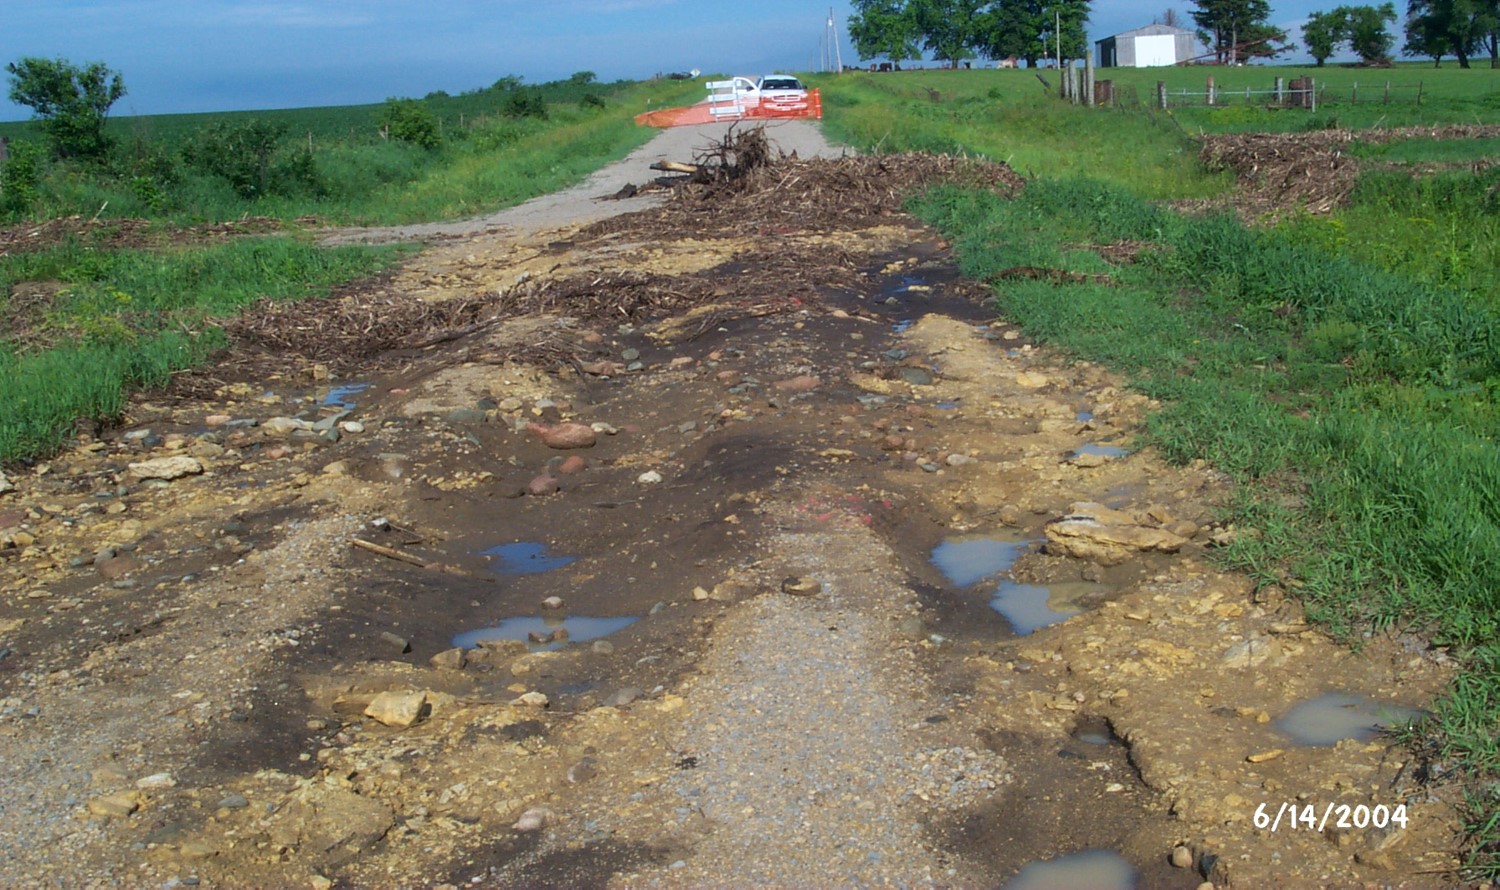
Much of the documented cost associated with flooding includes damage to roads, bridges, businesses, houses, and other physical infrastructure that occurs during a flood event. A closer look at public infrastructure in the UWR Watershed and the impact of flooding on public infrastructure is provided in the following Story Map.
Limitations in City and County Budgets
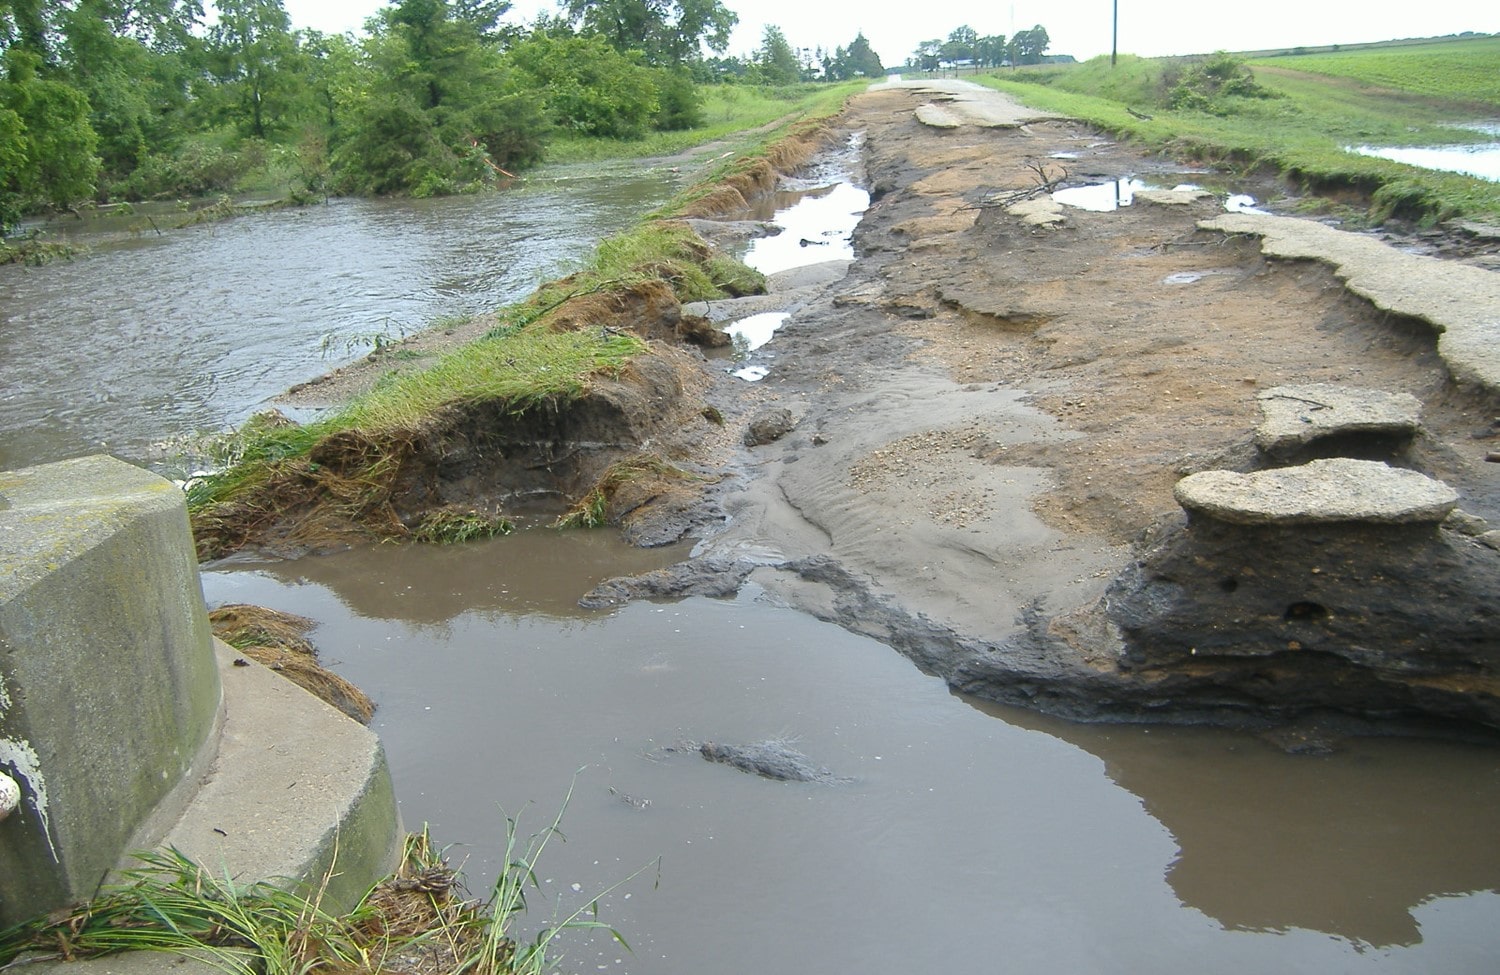
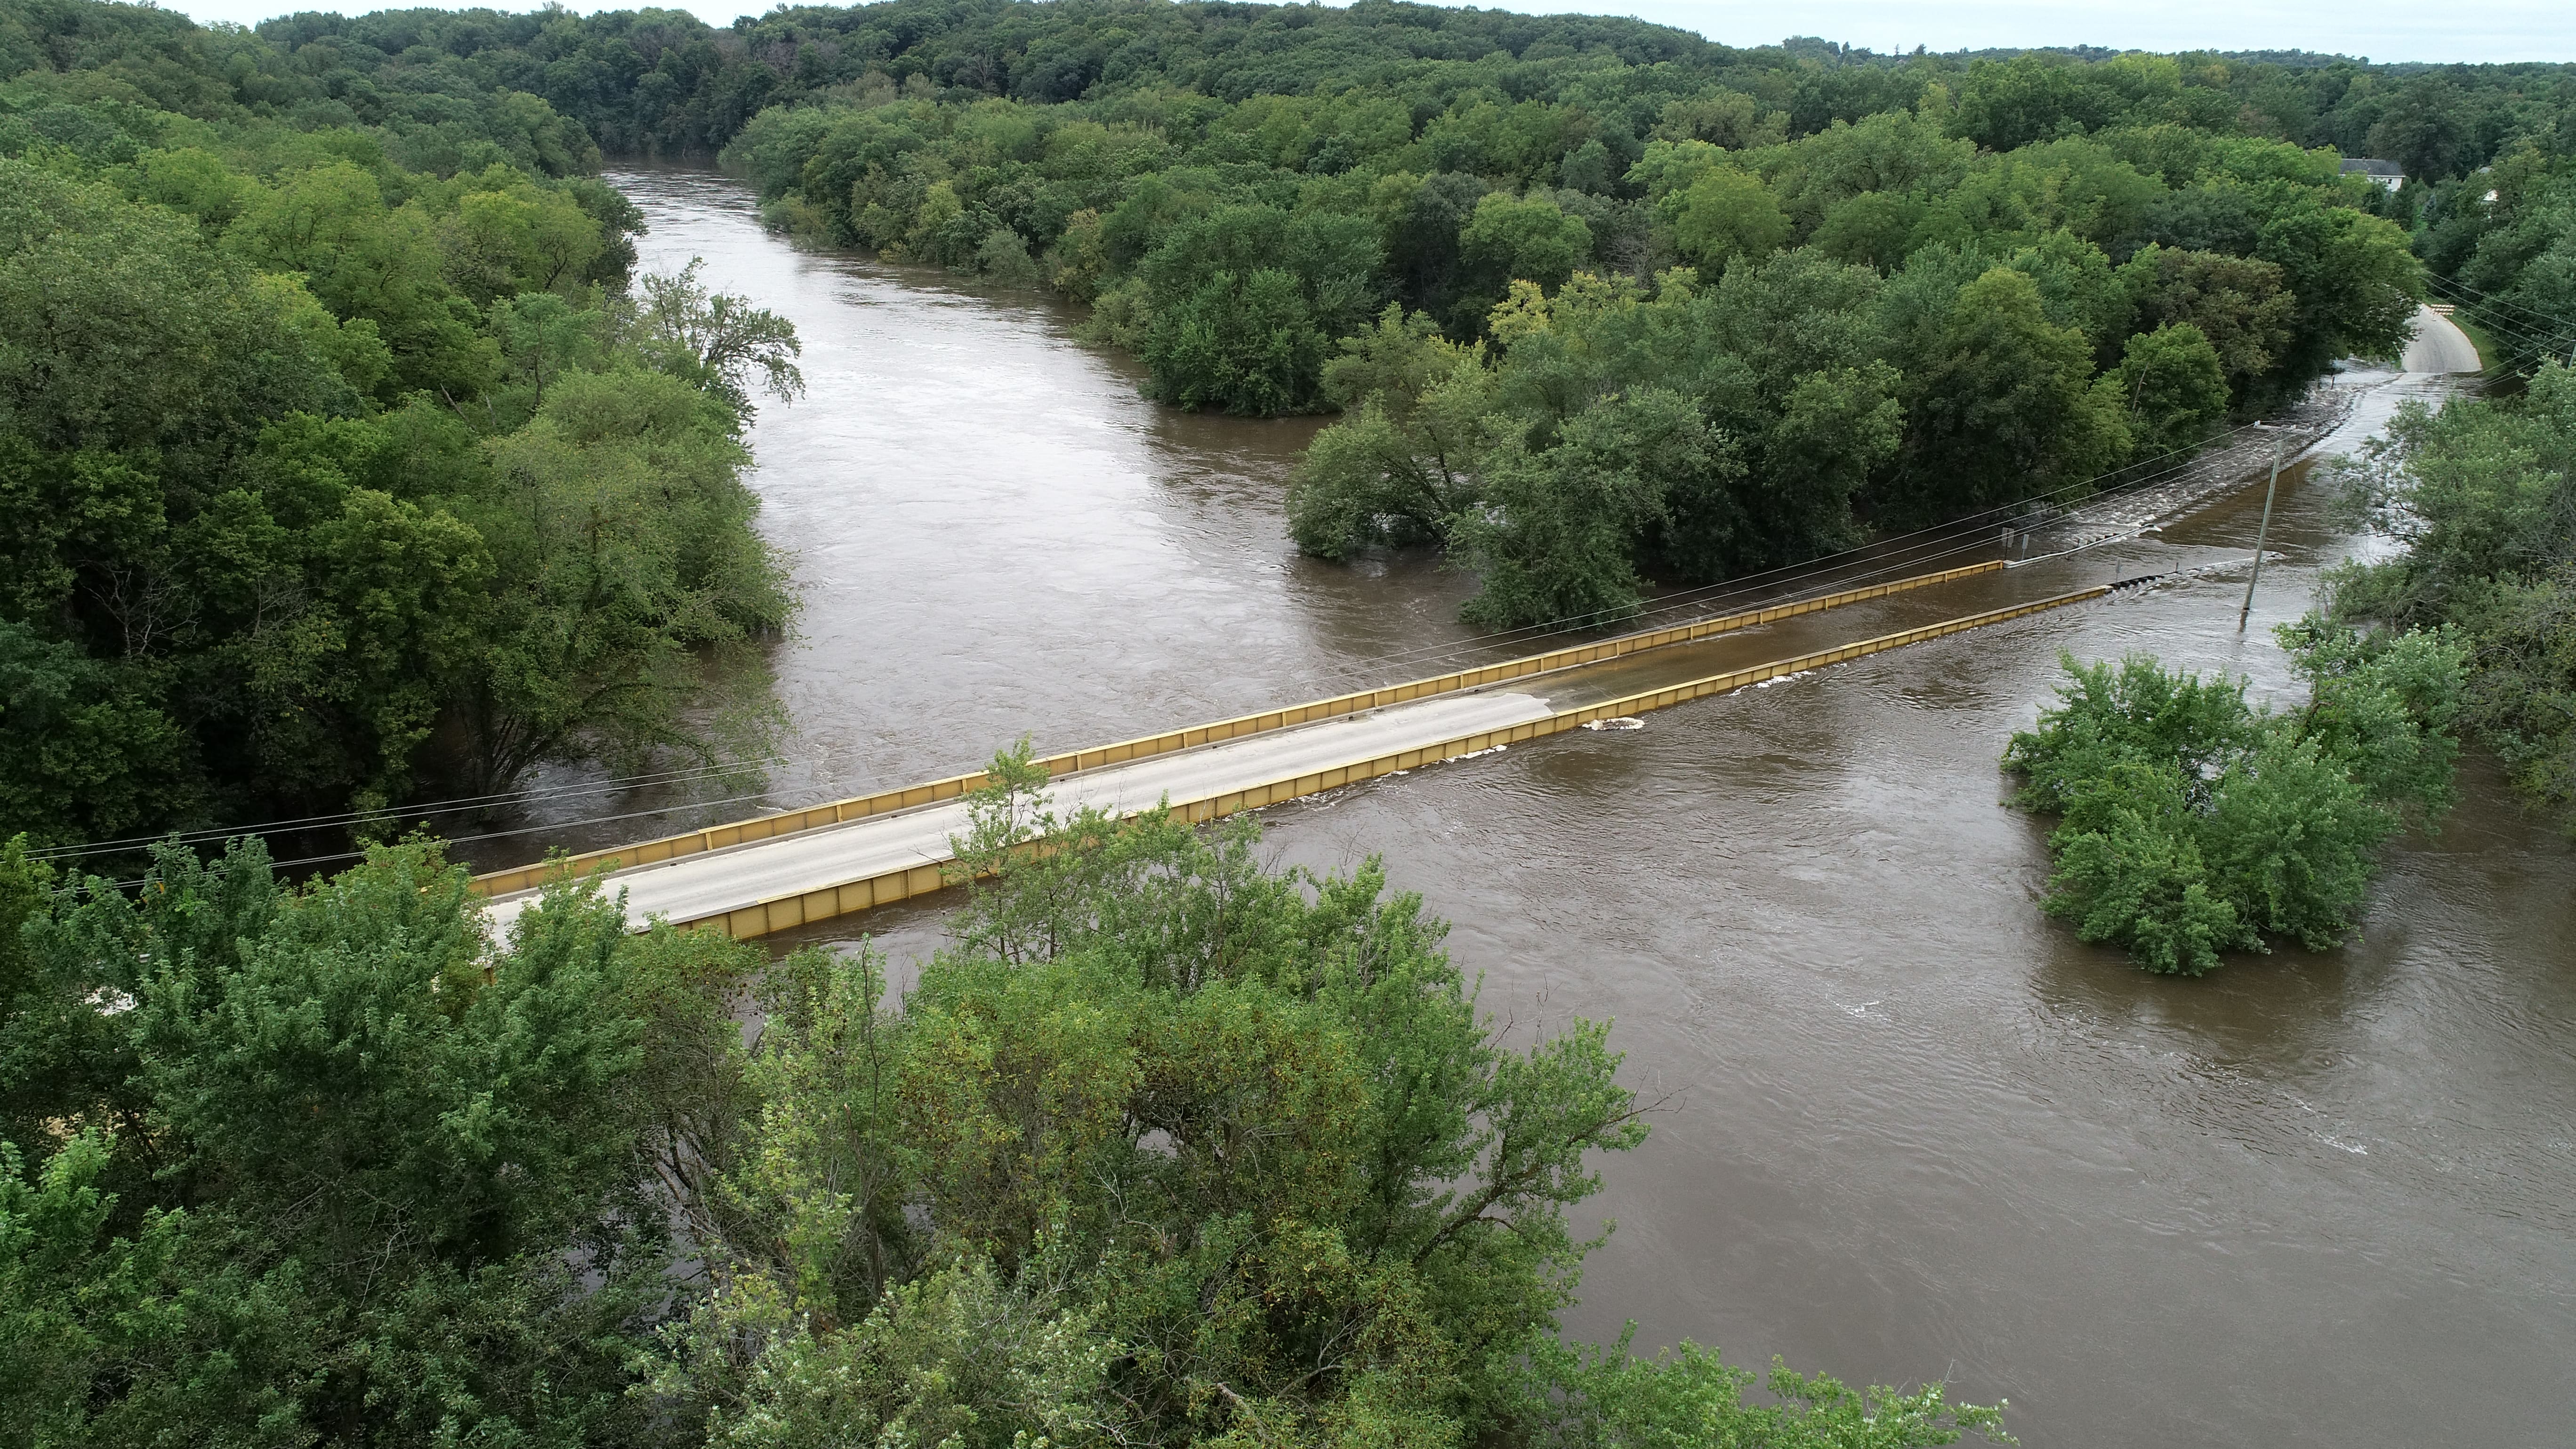
Even though county secondary roads and engineering departments work to secure state and federal grant and program dollars for road and bridge projects, funding for timely bridge and road replacement is extremely limited. As a result, road and bridge infrastructure is aging and in some cases bridges have deteriorated to the extent that they have been closed because of funding limitations imposed by Iowa Code. Exacerbating the issue, the bridges, and some of the roadways in the UWR Watershed are directly in the path of increasingly powerful floodwaters. Several state and national studies have determined that the number one cause of damage to bridge infrastructure is flooding and that several bridges can be severely damaged in just one major flood event costing taxpayers millions of dollars.
County Roads and Bridges
Over 3,000 miles of hard surface and gravel roads meander through the Upper Wapsipinicon River Watershed. The flat landscape of the Iowan surface allows for roads to run straight and square, forming a grid like texture over the landscape. The watershed encompasses sections of eighteen state highways and two federal highways. Roads in the watershed come into close connection with streams and rivers, in some cases traveling parallel to the stream or river. There are 846 bridges and thousands of culverts in the UWR Watershed. County engineers report that several hundreds can be impacted during one flood event. As noted below, a recent national studies reported that flood and scour contributing to almost 53% of the bridge failures. According to an Analysis of Recent Bridge Failures in the United States reported by the Journal of Performance of Constructed Facilities and conducted by Kumalasari Wardhana and Fabian Hadipriono on over 500 bridge structure failures that occurred in the United States between 1989 and 2000, the most frequent causes of bridge failures were attributed to floods and collisions with flood and scour contributing to almost 53% of the failures. 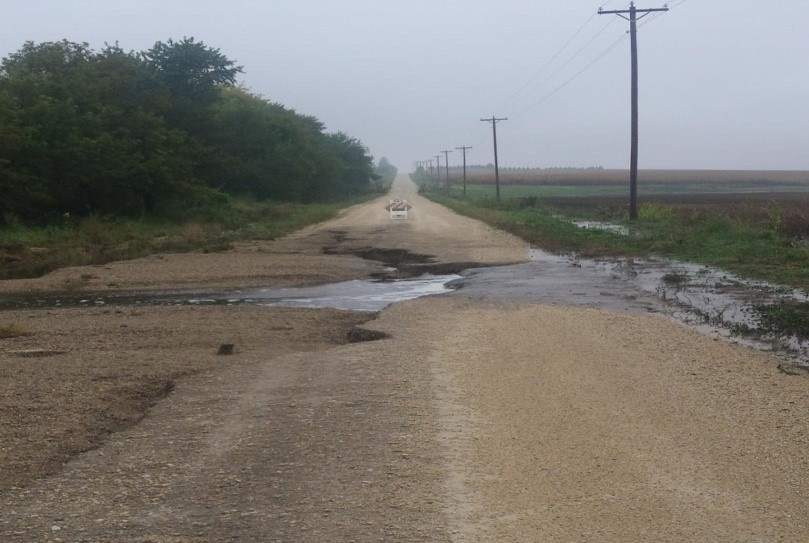
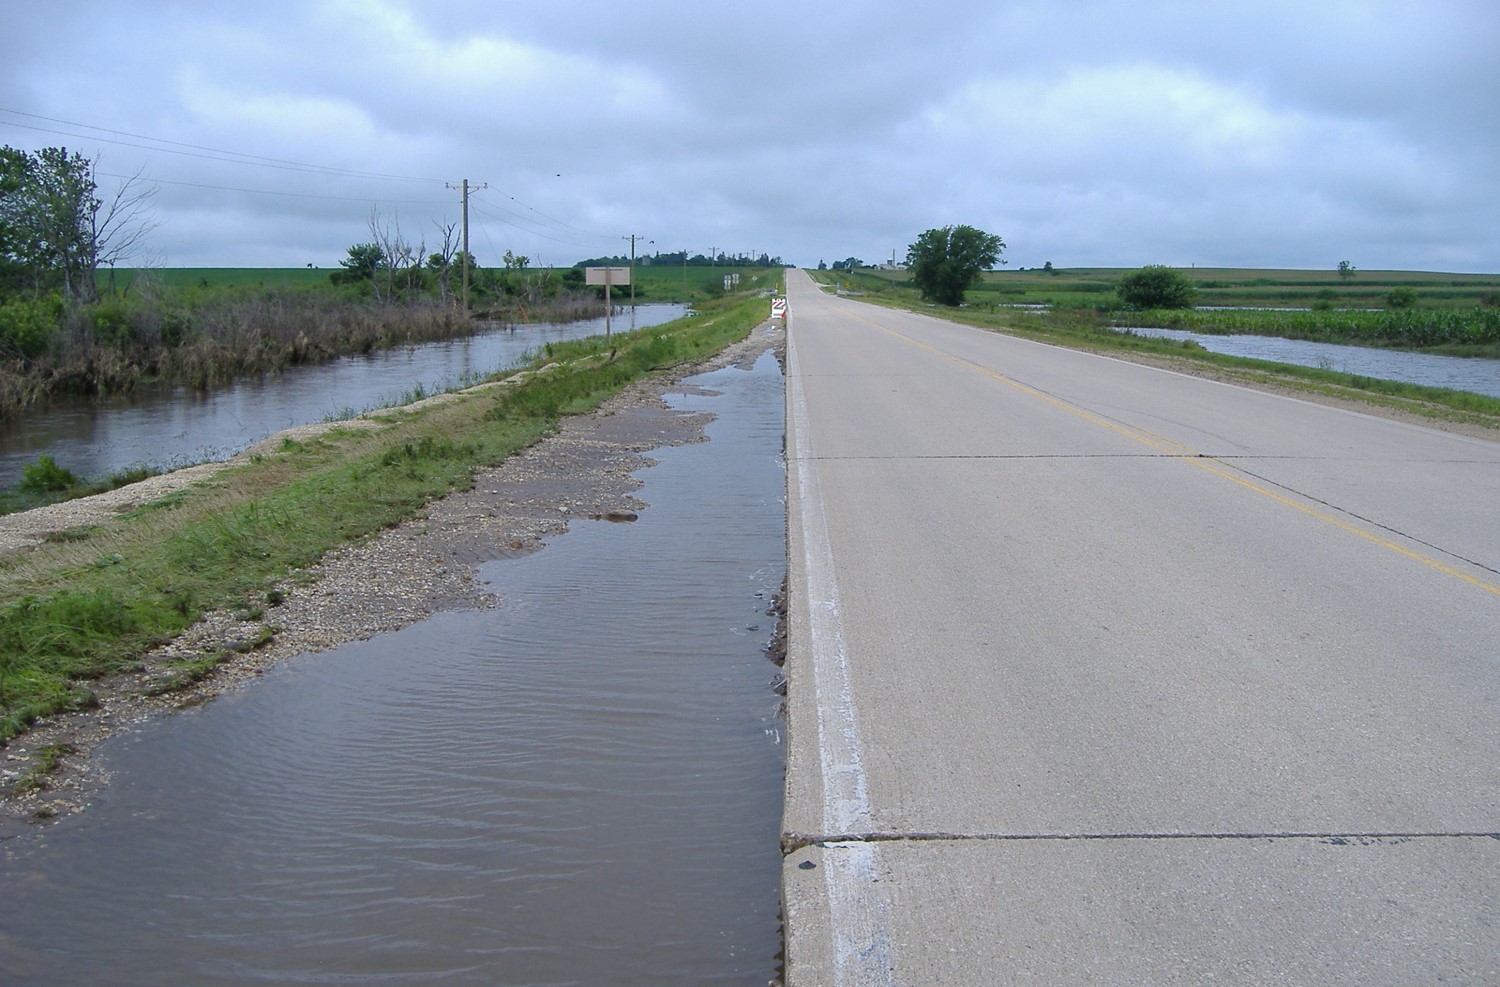
Roadways over the Upper Wapsipinicon River and its tributaries are subject to washouts and other damage caused by flooding and high flow. Flooding in Chickasaw County in 2016 caused many roads to be washed out or closed due to water over the roads. An article in New Hampton Chickasaw County Tribune by Bob Fenske interviewed the Chickasaw County Engineer Dustin Rolando who said,
“Numerous roads had to be closed because they were under water, and even those that didn’t flood suffered damage. ’I’m sure we’ve lost a ton of rock again,’ Rolando said, ‘and I know of a couple of roads that we had gotten rock on are almost bare again. We just can’t catch a break.’ Rolando had estimated that county roads suffered $450,000 worth of damage during the August flooding.” http://www.nhtrib.com/news/area-endures-another-round-flooding
Similarly, to flooding in New Hampton in 2016, Buchanan and Delaware counties suffered similar damages during flood events in June of 2018. Multiple roads were reported washed out after severe thunderstorms hit the UWR Watershed dumping over two inches of rain. https://kmch.com/blog/2018/06/10/wind-heavy-rain-and-flooding-hits-eastern-iowa/
The national analysis associated with and local accounts of bridge failures is significant given that until the past six years, flood prevention has not typically been a consideration for bridge replacement. Condition, use, detour length, funding availability, and other factors have been priority factors for county engineers considering bridge replacement. As flood frequency, size and scope increase, protection of both roads and bridges from flood and scour impacts is becoming even more relevant, especially given limited county resources and financial constraints.
UWR WMA partners are currently evaluating how the implementation of flood-prevention strategies throughout the watershed can protect roads and bridges and thereby decrease the economic impact of flooding to the cities, counties, state, and federal government. The Buchanan County Engineer is also in the process of completing research to identify the most effective methods for stabilization of a road base to protect critical transportation infrastructure from stormwater events that result in high levels of runoff and flood events. This information will inform future protection of roads and bridges and taxpayer dollars.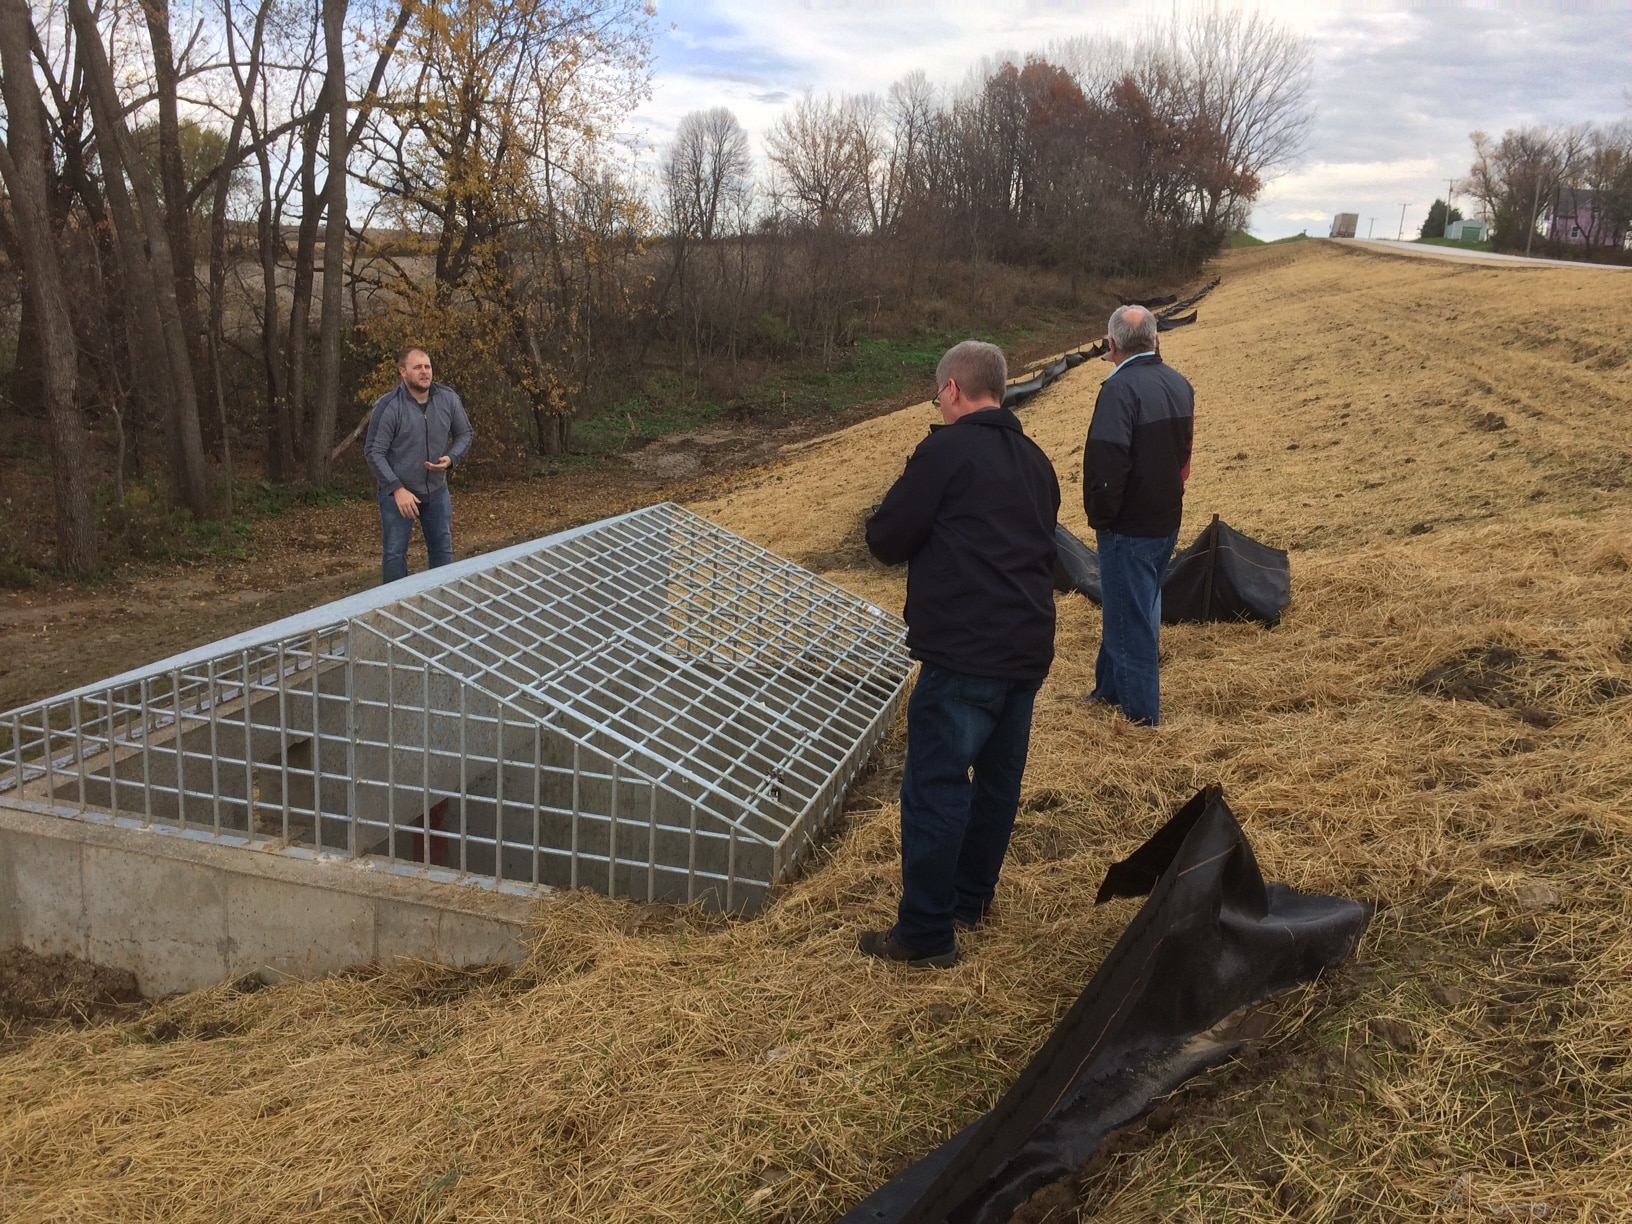
Recognizing the actual and potential cost of flooding to county infrastructure, three of the UWR Watershed County Board of Supervisors and County Engineers in the upper portion of the watershed have adopted policies to utilize secondary roads to help increase watershed resiliency and decrease the impact that flooding has on county infrastructure in the future. The policy encourages consideration for and implementation of on-road structures during regular culvert replacement. Although it would slightly increase the cost of any individual project, implementation of the policy is expected to save on future road and bridge repair and replacement costs. Some Iowa counties have worked with landowners to implement “on-road” or road embankment structures. On-road structures are typically placed where a county roadway dips with the landscape; the road is built up, creating a dam like structure that can hold stormwater runoff temporarily. The use of a special outlet culvert allows the structure to temporarily hold back water during a large rain event and then release it at a reduced volume over a few days. An easement or agreement between the landowner and county engineer is established with the arrangement that water may be temporarily backed up onto the private land. Responsibility for inspection and maintenance is also assigned. These structures have multiple benefits, improving the safety of the roadway, protecting downstream infrastructure and reducing flow during rain events. They can also provide water for livestock and a water source for the fire departments (dry hydrant), which is particularly helpful in rural areas where other water sources are scarce.
Bridge Condition Index – “Poor Condition” Bridges in the UWR Watershed
A bridge’s rating, as determined using the Bridge Condition Index, is a significant consideration. Bridges are rated based on the quality of the structure, as explained in the U.S. Department of Transportation Federal Highway Administration’s Recording and Coding Guide for the Structure Inventory and Appraisal of the Nation’s Bridges. The National Bridge Inventory includes an assessment of the physical conditions associated with the flow of water through bridges 20 feet wide or greater. It includes identification information, bridge types and specifications, operational conditions, and much more.
According to the National Bridge Inventory, there are 846 inventoried bridges in the UWR Watershed, and only 21 are not over a waterway. Infrastructure in the UWR Watershed is deteriorating due to age, usage, and damages caused by flooding. The National Bridge Inventory measures the bridge condition index which shows the overall condition of the bridge as explained in the U.S. Department of Transportation Federal Highway Administration’s Recording and Coding Guide for the Structure Inventory and Appraisal of the Nation’s Bridges. This measurement takes into consideration criteria such as structural condition, load carrying capacity, horizontal and vertical clearance, width, traffic levels, type of roadway it serves and length of detour if that bridge were closed. A bridge that is in good condition is adequate for today’s traffic and vehicle loads. A bridge in poor condition is not unsafe but should be considered for repair, replacement, restriction posting, weight limits, or monitoring on a more frequent basis. Based on the Iowa DOT data for bridge condition, there are 75 bridges considered in poor condition in the UWR Watershed. The story map below shows the bridge locations in Iowa and their condition based on current and historical National Bridge Inventory data.
The inner point represents any restrictions placed on the bridge structure. Restrictions include weight restrictions or closed to all traffic. The middle ring represents bridge serviceability according to the Federal Bridge Rating Standard. Bridges are either non deficient or structurally deficient. The Iowa DOT defines structurally deficient as, “One of more structural elements are in need of repair or replacement. Bridge length may be inadequate for waterway size. Load carrying capacity may be insufficient for today’s legal truck sizes.” The outer ring for each bridge point shows the Iowa Bridge condition index. The Iowa DOT defines this measurement by,
“The Iowa Bridge Condition Index reflects the overall condition of the bridge, taking into account things such as structural condition, load carrying capacity, horizontal and vertical clearances, width, traffic levels, type of roadway it serves, and the length of out-of-distance travel if the bridge were closed.
Good: All elements of the bridge are sound. No maintenance is needed.
Fair: All elements are sound. Some preventive maintenance would prolong the life of the bridge.
Poor: One or more elements are deteriorating. Repairs or replacement will be needed in the near future.”
According to the Iowa DOT Bridge Inventory data, there are six closed bridges in the UWR Watershed, and 15% of bridges have some restriction or weight posting. According to the Iowa DOT Bridge Inventory, there are also 16 bridges in the UWR Watershed that are over 100 years old.
Data from the National bridge Inventory is used by county engineers to make decisions about which bridges to fix and replace, and figure out where the most problems with infrastructure are. Some engineers are starting to look at ways to protect county bridges from large flows that can cause damage or failure. According to ACPF results, and results from the Iowa BMP mapping project, many bridges are not protected upstream by ponds and WASCOBS that retain water during large rain events and slow flows under bridge structures. Bridges not protected by upstream ponds and WASCOBS are at more risk to high flows, which can cause structural damage or complete loss. Seventy-Seven percent of bridges have watersheds that are not well protected by water retention structures.
Economic Impact of Flooding on Businesses

The economic impact of flooding on rural Iowa businesses is poorly understood and difficult to quantify in any measurable way because it has rarely been recognized, reported, or recorded by any entity other than the individual business owners. Businesses are directly impacted by floodwaters, some of them are repeatedly. Over the past thirty years, dozens of Eastern Iowa businesses, located in areas of small communities that had never previously flooded or aren’t even in the floodplain, have been hit repeatedly by flooding and as a result, closed their businesses or abandoned their damaged properties. As flood-damaged buildings are left vacant and deteriorating, other nearby businesses suffer. An even greater number of businesses are believed to be impacted by secondary economic stressors. Many are impacted by the loss of customers and sales directly before, during and, after a storm event, during preparation for an event and during event clean-up. Disposable customer income that may have been spent on services, movies, dinner, new clothes or other items must be redirected to home repair and temporary living expenses. A loss of employee productivity, damaged or spoiled inventory related to an electrical outage or low sales, detours that take customers away from businesses, and other factors can also impact sales and profitability. Combined, these stressors can have a devastating impact on both short and long term business viability. Impacted businesses can include everything from grocery stores, restaurants, clothing stores, and specialty shops to factories and other large businesses.
Reducing the Impacts of Flooding Through Mitigation
The impact of flooding can be reduced through widespread implementation of the UWR WMA strategies and actions. These strategies were developed after consideration of state of the art scientific analysis and through consultation with a diverse group of experts from many different fields.
According to a National Institute of Building Sciences’ Natural Hazard Mitigation Saves: 2017 Interim Report, investment in flood plain buildings, updating building design policies and other preventative measures could save the nation $6 in future disaster costs, for every dollar spent. The report did not even touch on the investment return of reducing or preventing flooding through the implementation of strategies in the upper regions of a watershed. They note, “The Institute’s project team looked at the results of 23 years of federally funded mitigation grants provided by the Federal Emergency Management Agency (FEMA), U.S. Economic Development Administration (EDA) and U.S. Department of Housing and Urban Development (HUD) and found mitigation funding can save the nation $6 in future disaster costs, for every $1 spent on hazard mitigation.” The report recommended the following public-sector and building code strategies related to flooding.
- For flood resistance, acquiring or demolishing flood-prone buildings, especially single-family homes, manufactured homes and 2 to 4 family dwellings.
- For flood resistance (to address riverine flooding and hurricane surge), building new homes higher than required by the 2015 IBC.
The National Institute of Building Sciences recommends mitigation but also recognizes that not everyone is willing or able to bear the construction costs for more resilient buildings even when long-term benefits exceed up-front costs. They note,
In a 2015 white paper and 2016 addendum, the Institute’s Multihazard Mitigation Council (MMC) and Council on Finance, Insurance and Real Estate (CFIRE) proposed a holistic approach to incentives that can drive financing mitigation investments, aligning the interests of multiple stakeholder groups so that they all benefit from natural hazard mitigation. The BCRs identified in the 2017 Interim Report can facilitate the development of specific strategies that align incentives from finance, insurance, government, and other stakeholders. View the white paper, Developing Pre-Disaster Resilience Based on Public and Private Incentivization. View the Addendum to the White Paper for Developing Pre-Disaster Resilience Based on Public and Private Incentivization.
Although increasing our understanding of and reducing the impacts of flooding are difficult, there are a variety of information databases that collect weather, rain, and flood data for the Nation that are helpful for local agencies and residents. Early warning and action can also reduce the impact of flooding.