Total Suspended Solids
Total suspended solids is a measure of water clarity and is affected by the amount of material suspended in water. As more material is suspended, less light can pass through, making it less transparent. Suspended materials may include soil, algae, plankton, and microbes. Total suspended solids is the measurement of solid material per volume of water (mg/L). High measures of total suspended solids indirectly harms aquatic species when solids settle out and clog gills, destroy habitat, and reduce the availability of food. Furthermore, suspended materials in streams promote solar heating, which can increase water temperatures, and reduce light penetration, which reduces photosynthesis, both of which contribute to lower dissolved oxygen. Sediment also can carry chemicals attached to the particles, which can have harmful environmental effects. Sources of suspended particles include soil erosion, waste discharge, urban runoff, eroding stream banks, disturbance of bottom sediments by bottom-feeding fish (e.g., carp), and excess algal growth.
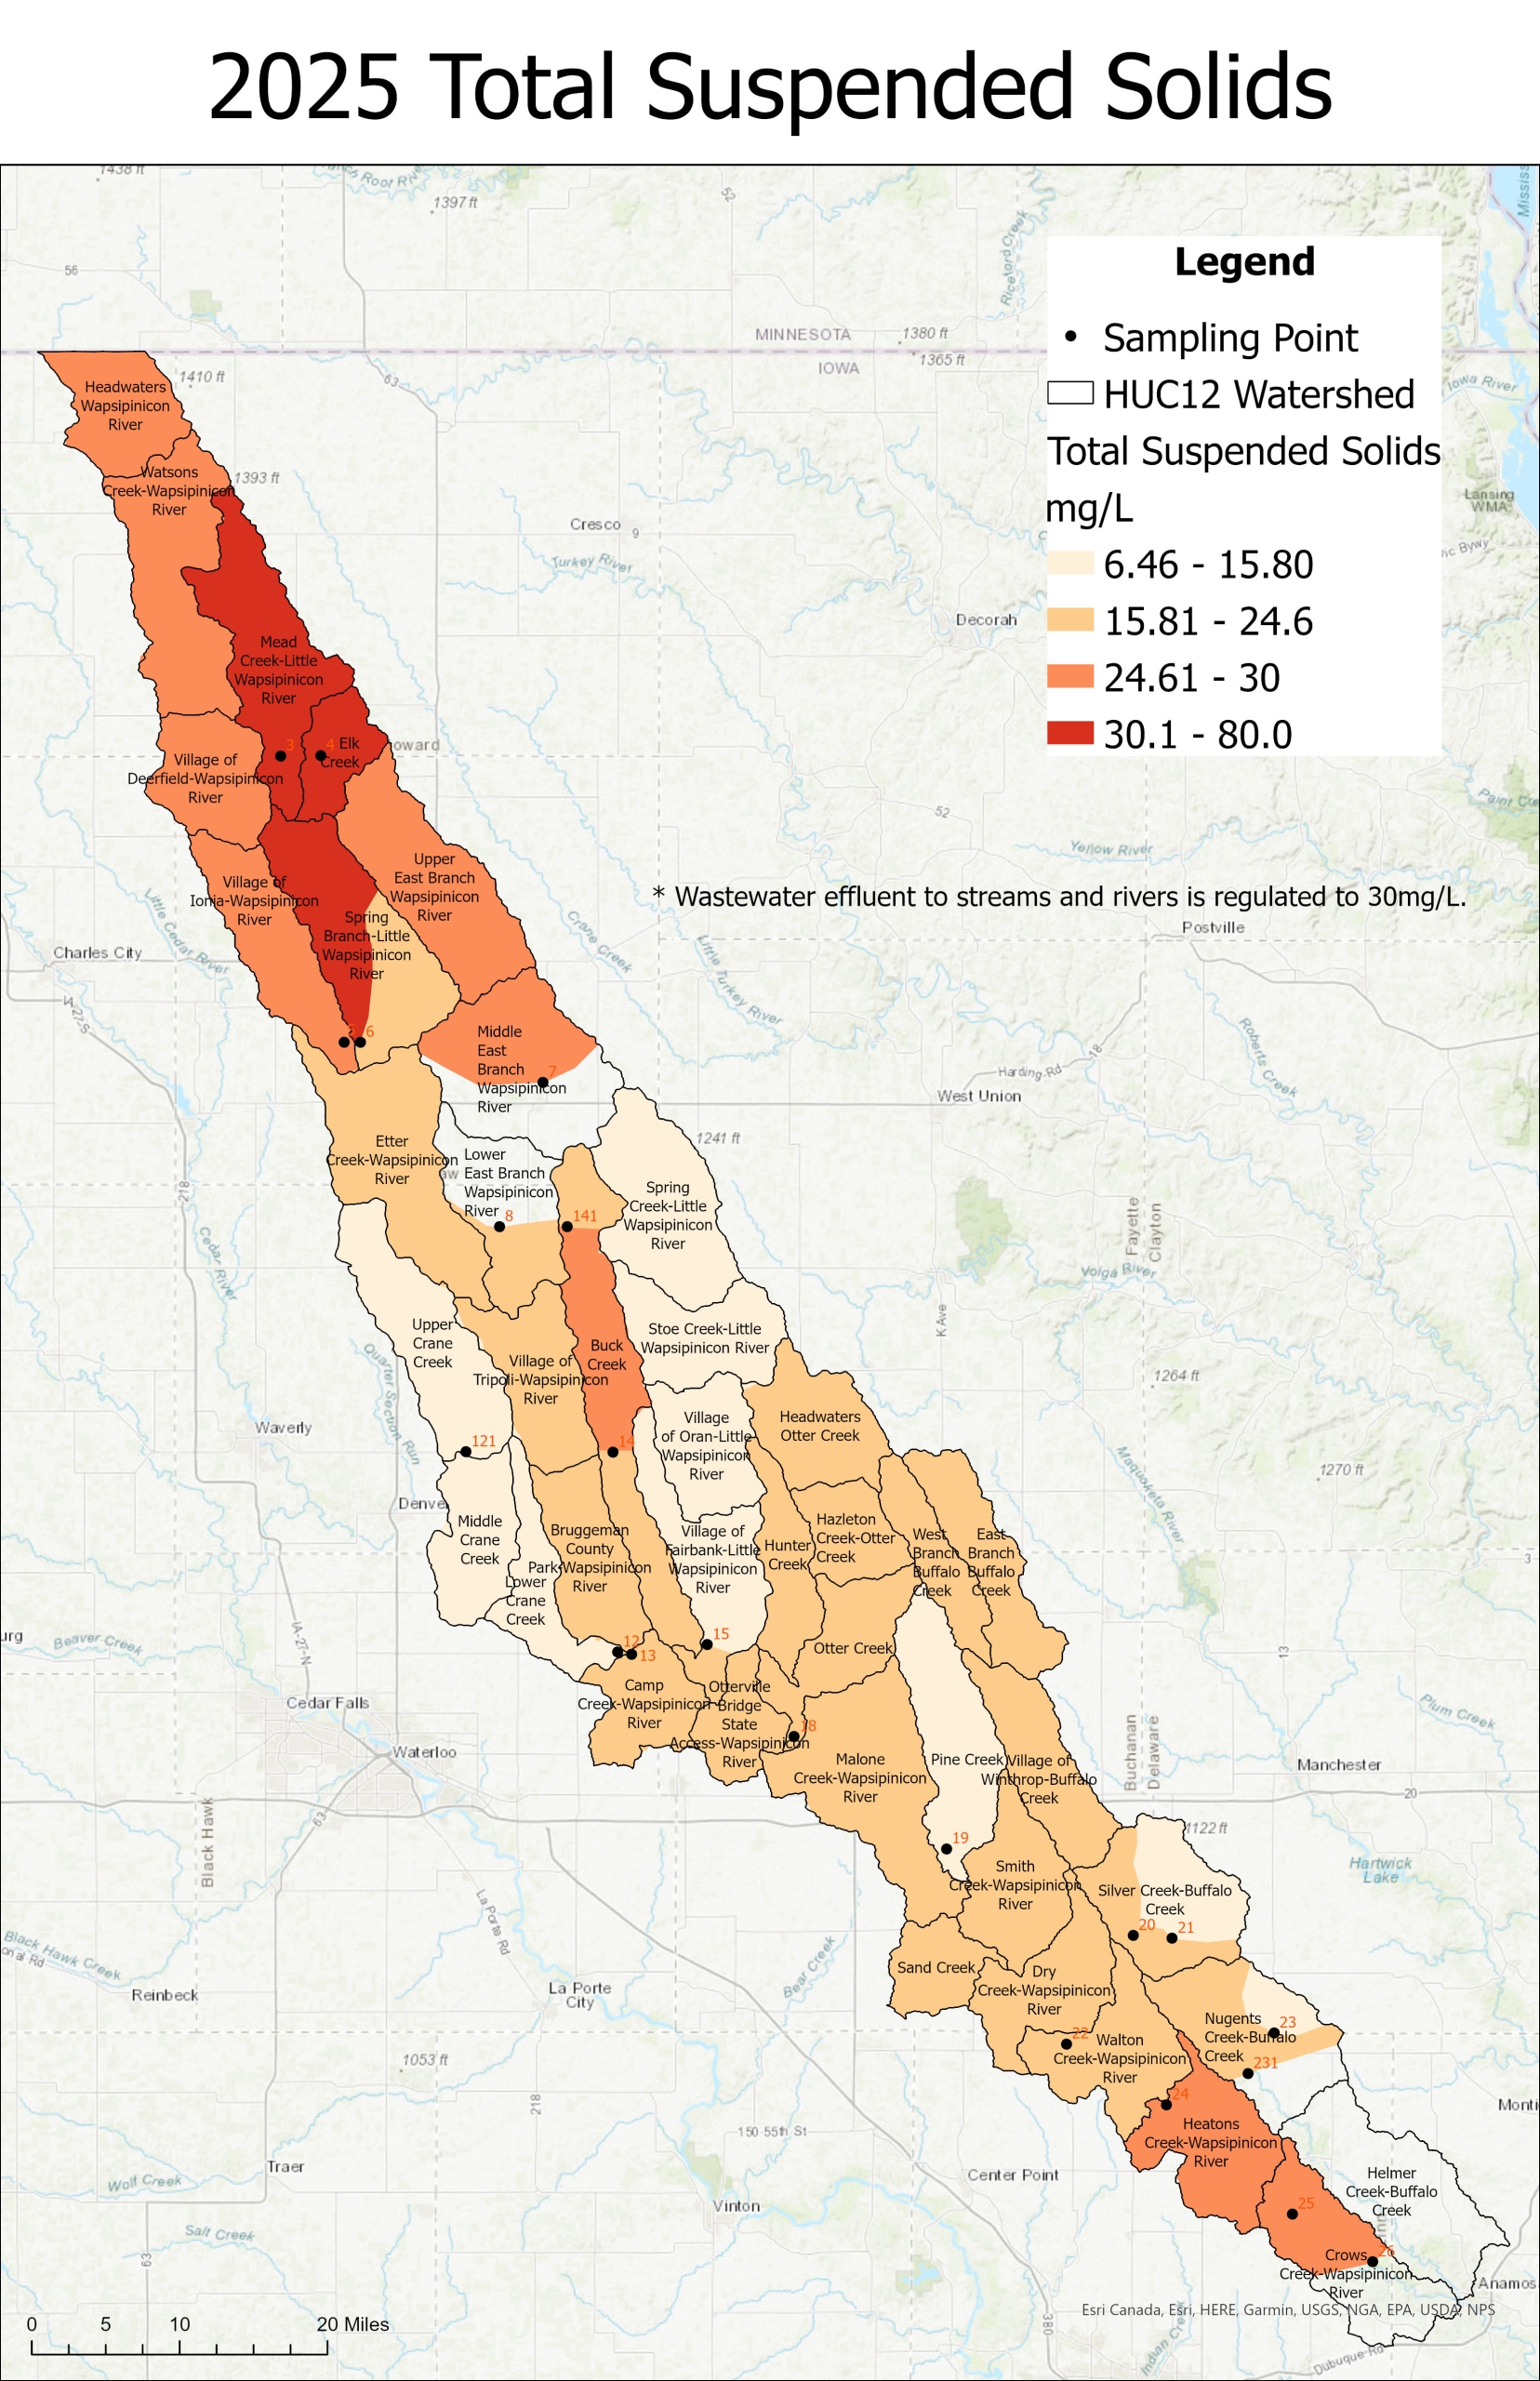
*Total Suspended Solid levels less than 20 mg/L, is recommended for cold-water aquatic life. While specific regulatory limits vary, levels below 30 mg/L are often considered reasonable for warm water aquatic habitat, with values over 40–80 mg/L indicating cloudy, potentially impaired conditions. Wastewater effluent is regulated to be less than 30mg/L.
Fondriest Environmental, Inc. “Turbidity, Total Suspended Solids and Water Clarity.” Fundamentals of Environmental Measurements.
13 Jun. 2014. Web. < https://www.fondriest.com/environmental-measurements/parameters/water-quality/turbidity-total-suspended-solids-water-clarity/ >
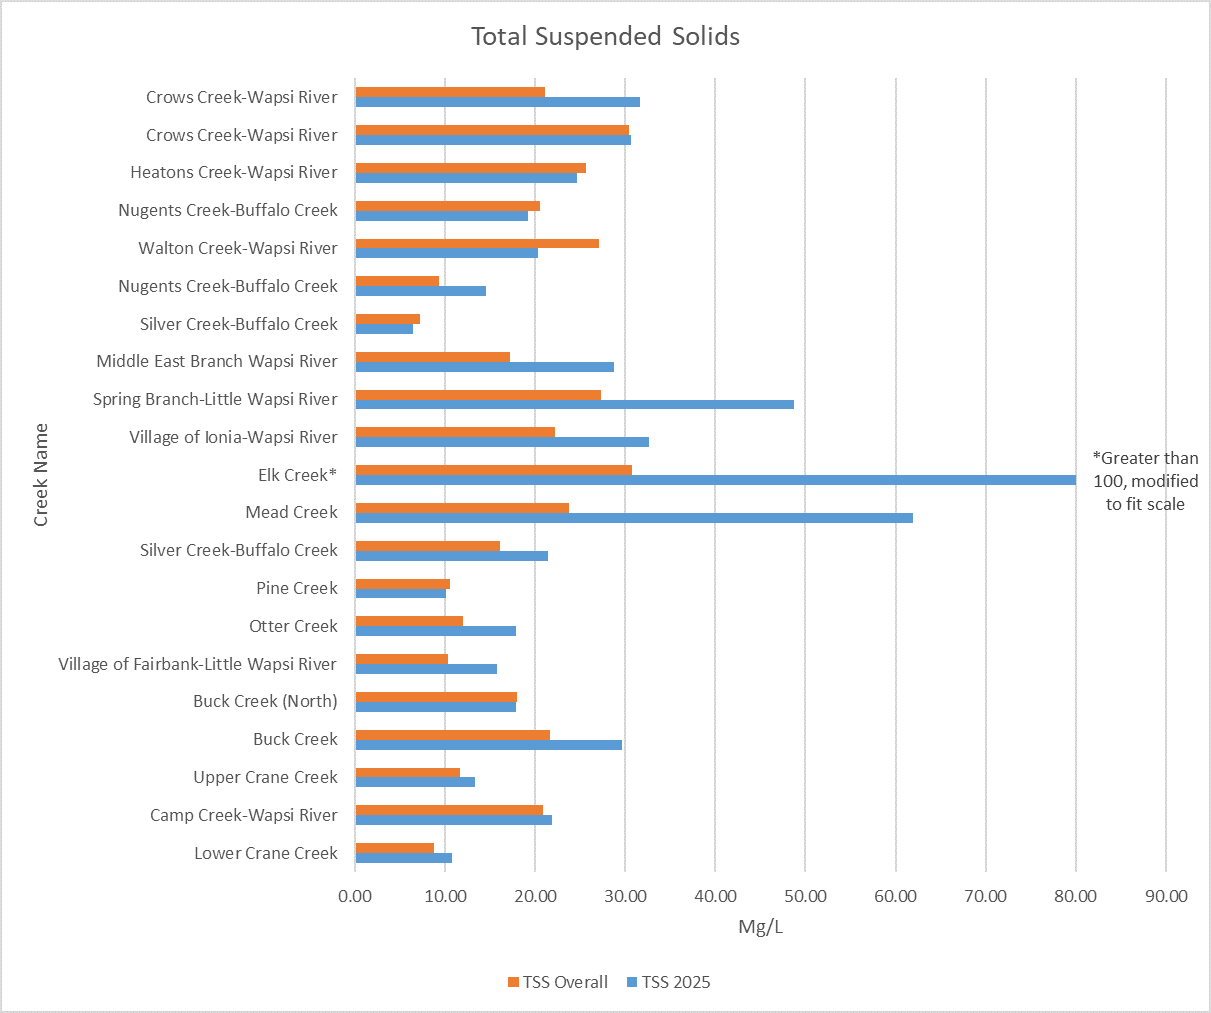
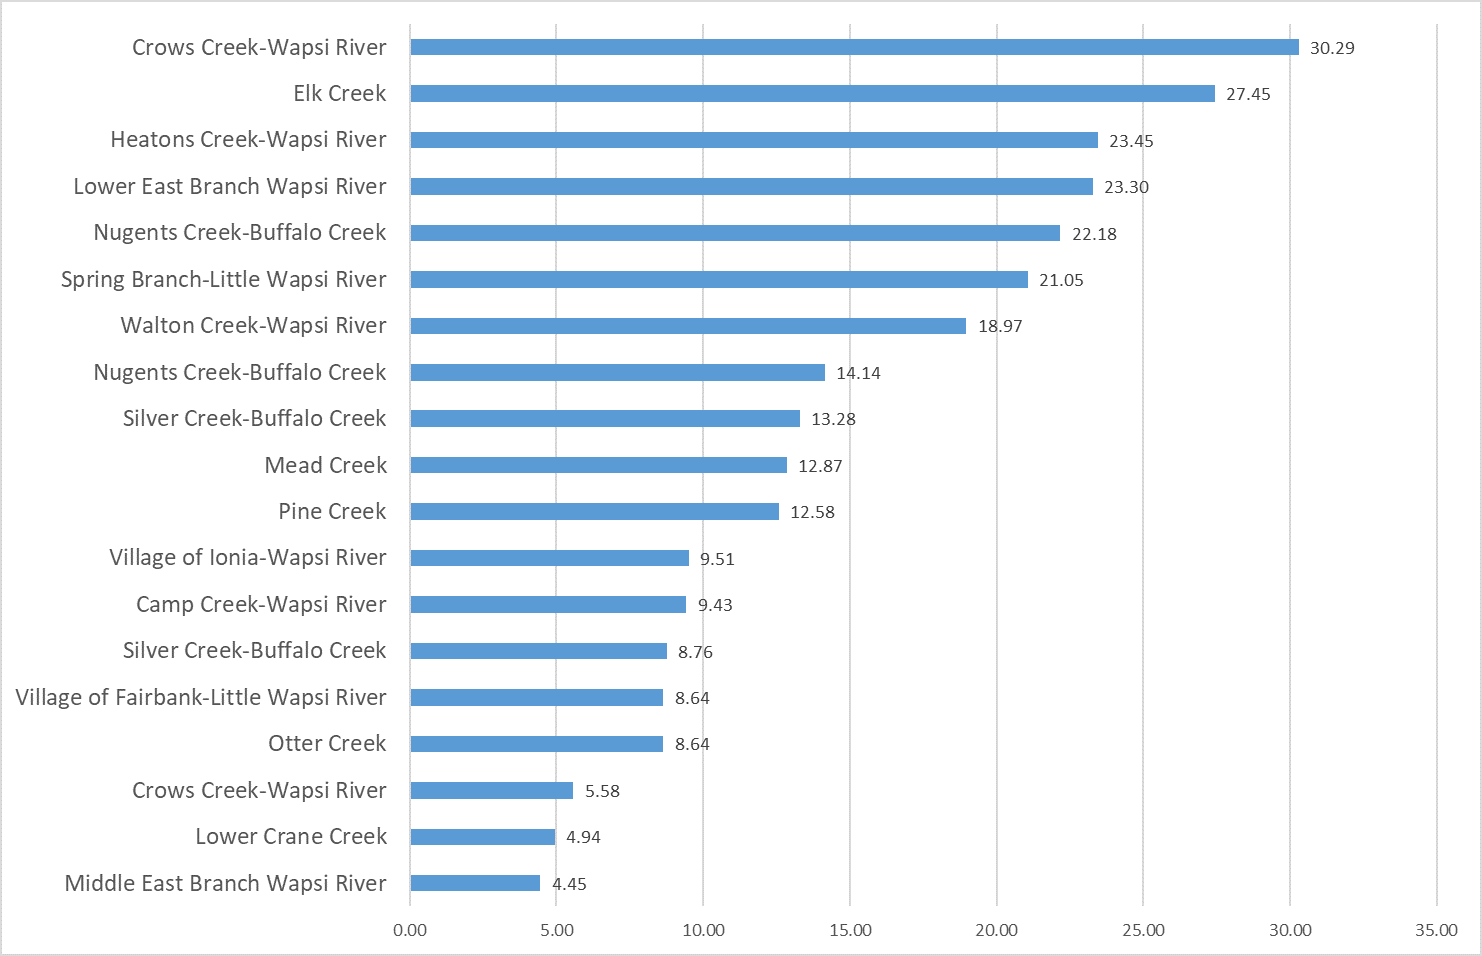
2025 Sampling Results
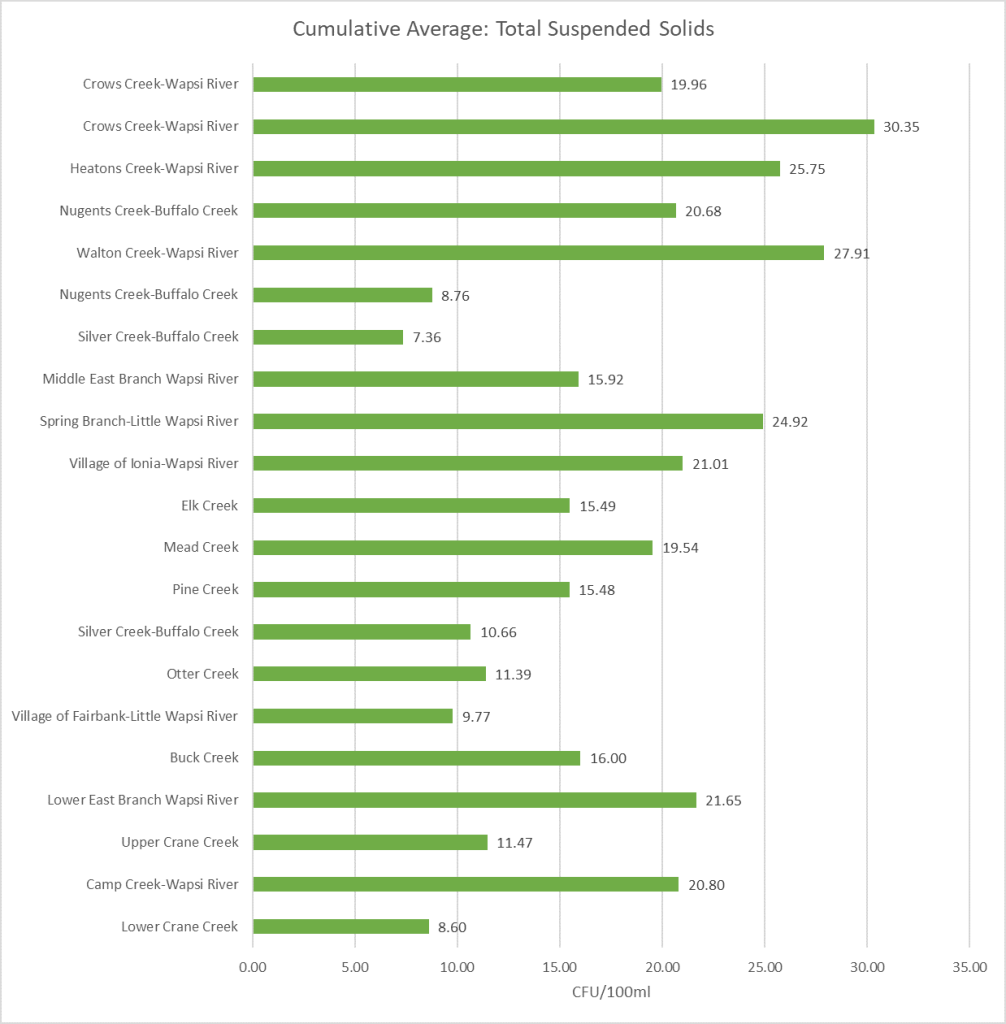
Cumulative Average: Total Suspended Solids

The above image shows all the total suspended solids data collected from 2015 to current years by using a box and whisker chart. The horizontal line within each box represents the average value in the data, while the lines that extend from the box represent the variation in data. To learn more about how to read a box and whisker chart click here.
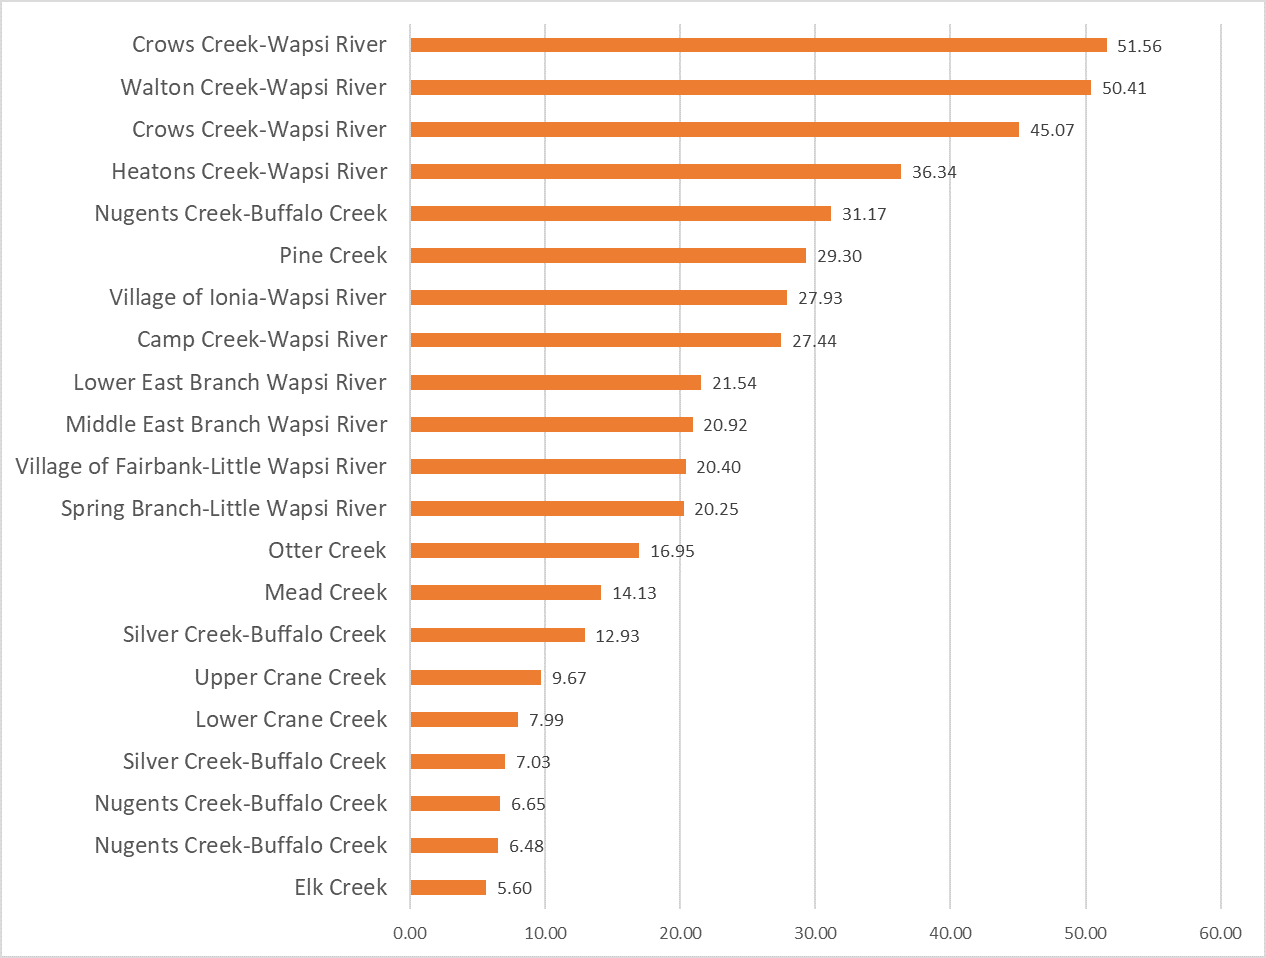
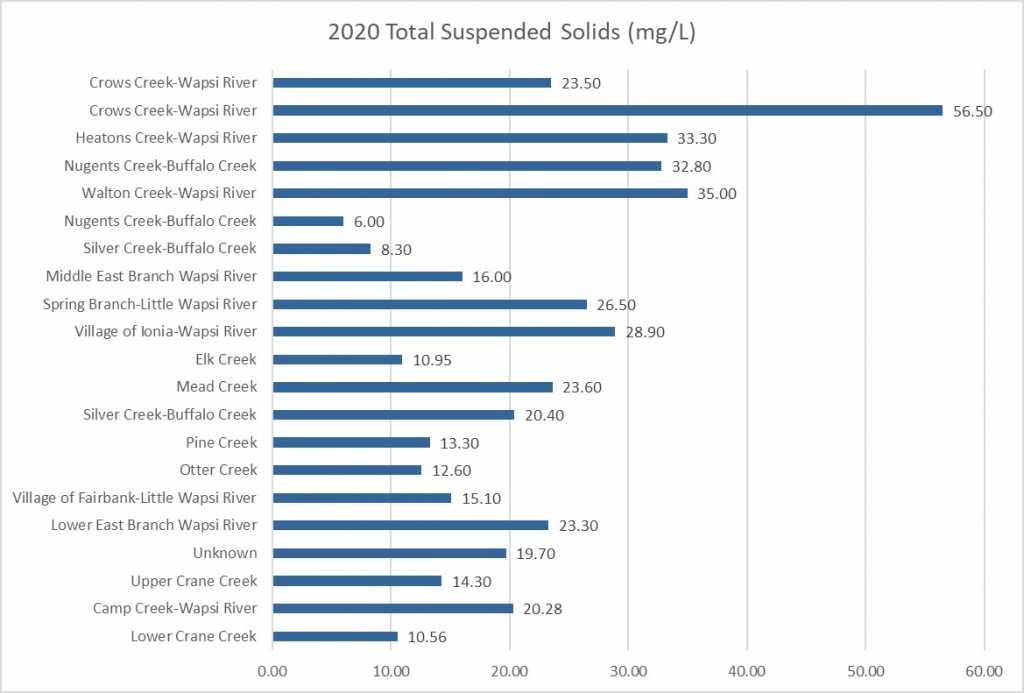
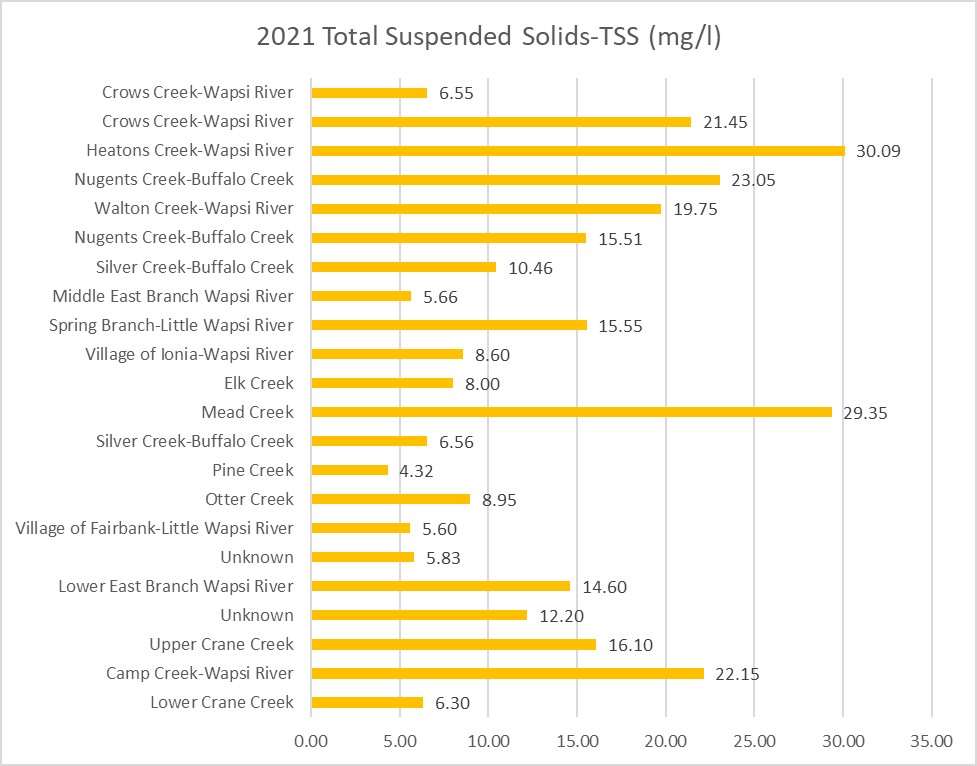
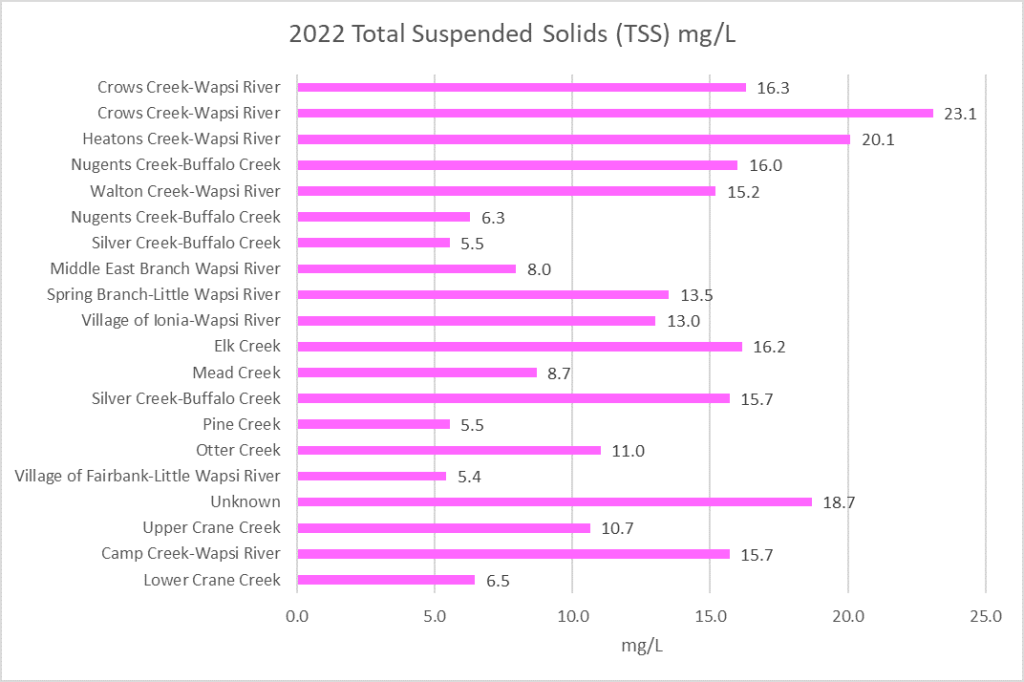
Historic Results by Sampling Year

2015 TSS
(Mg/l)
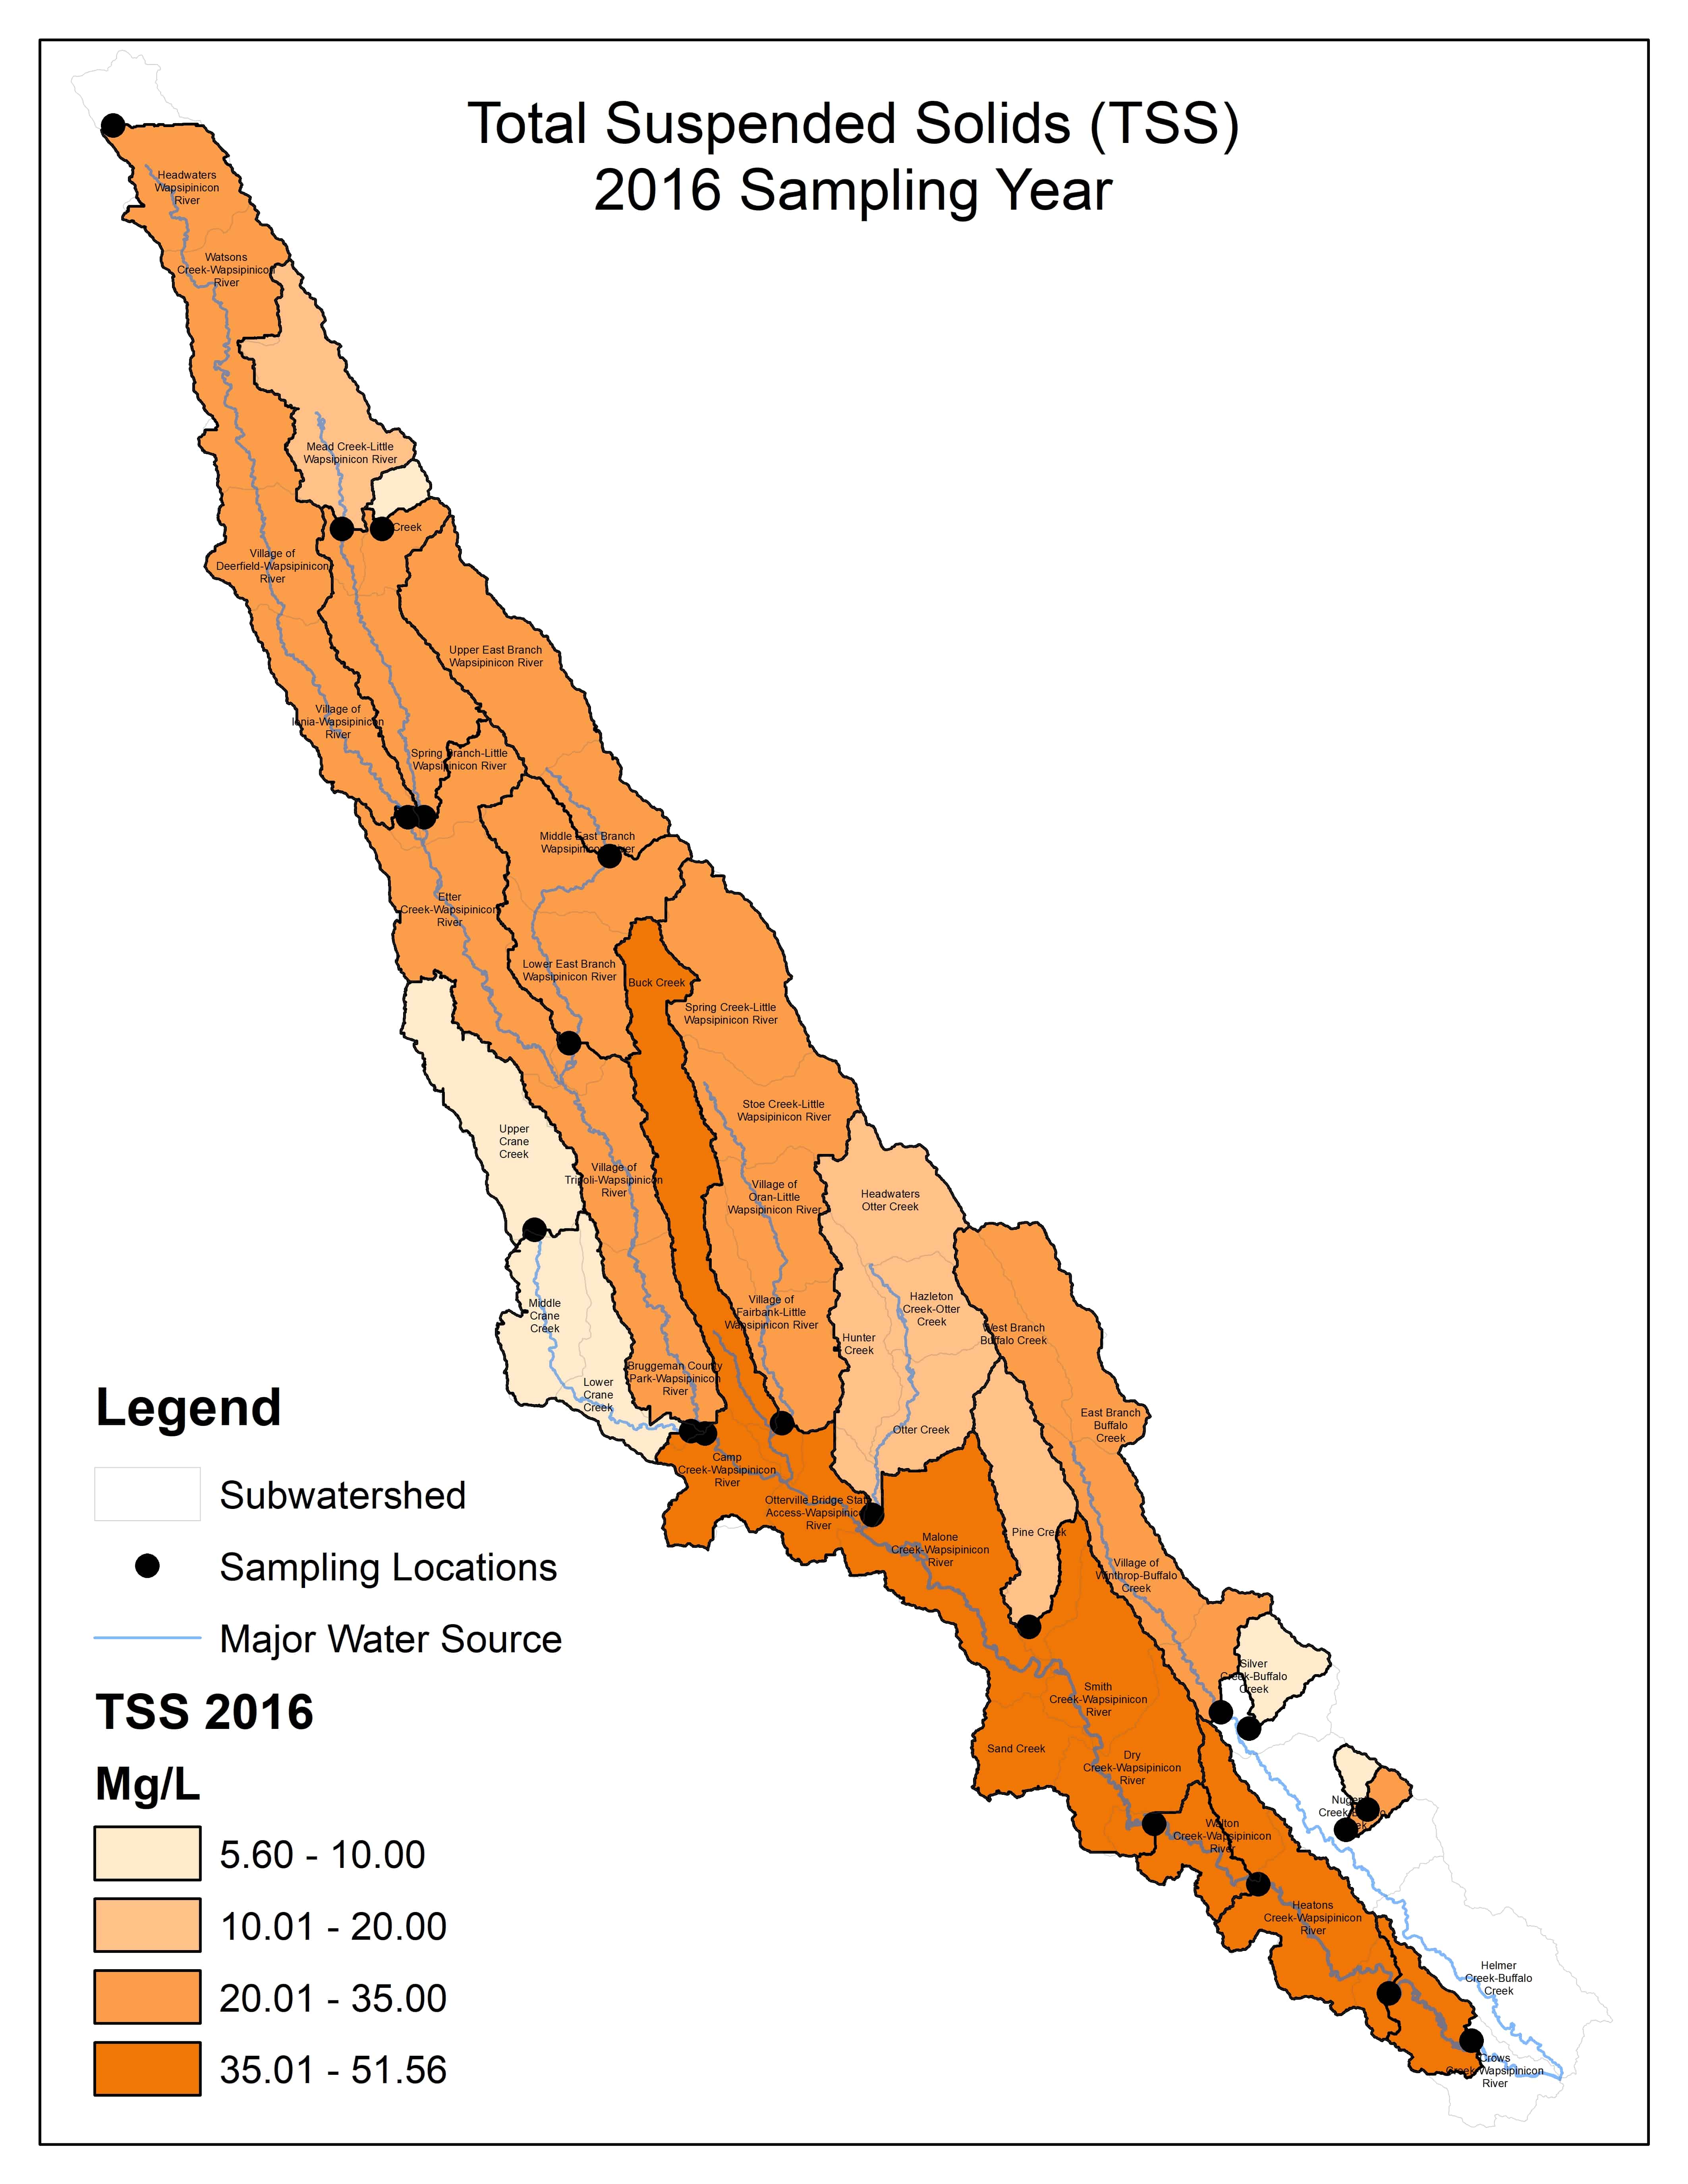
2016 TSS
(Mg/l)
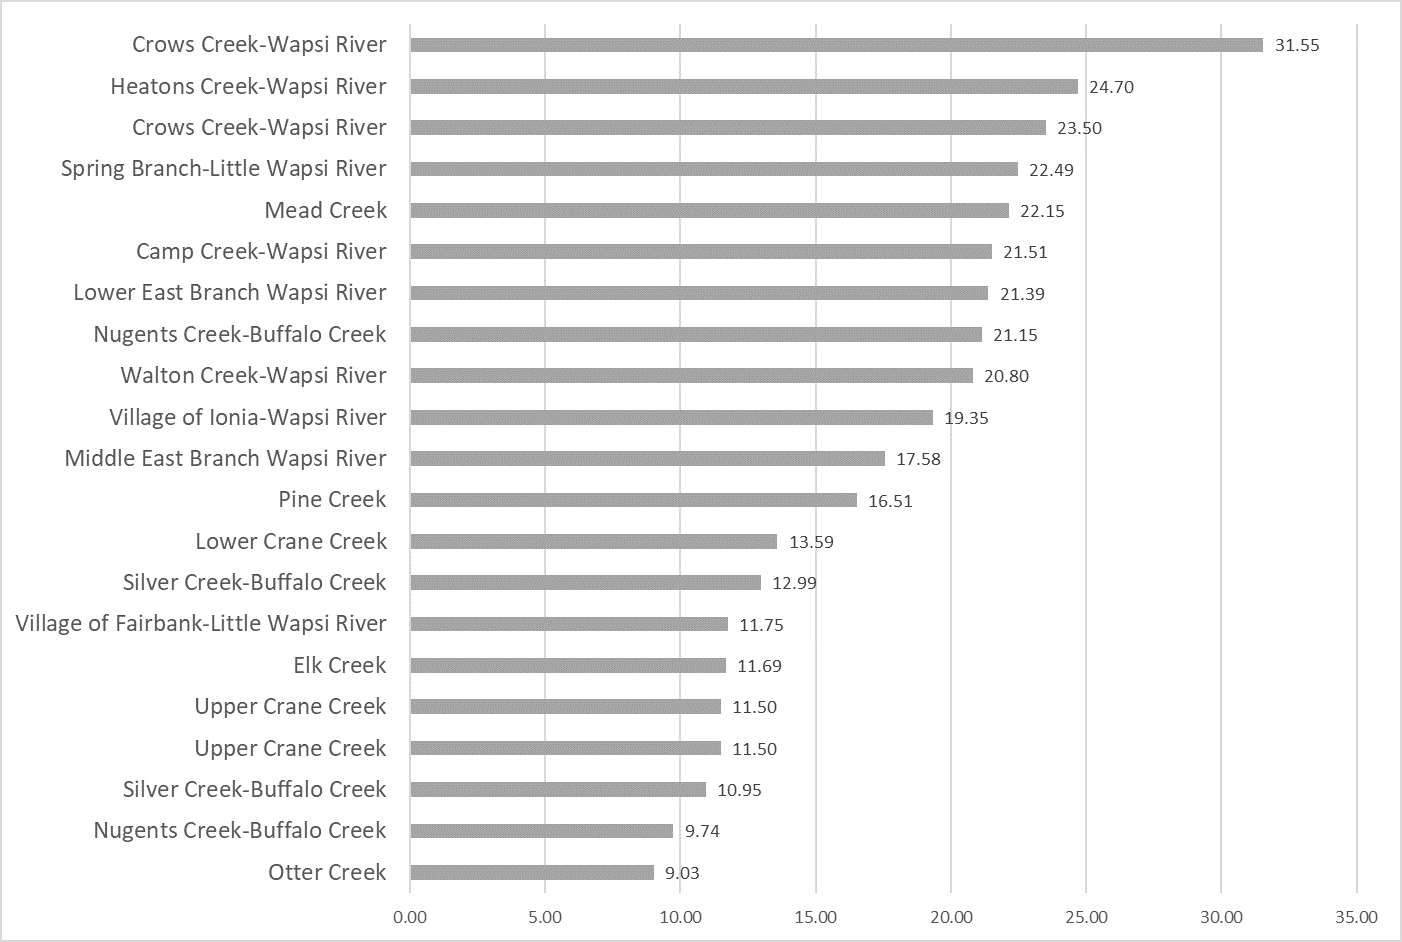
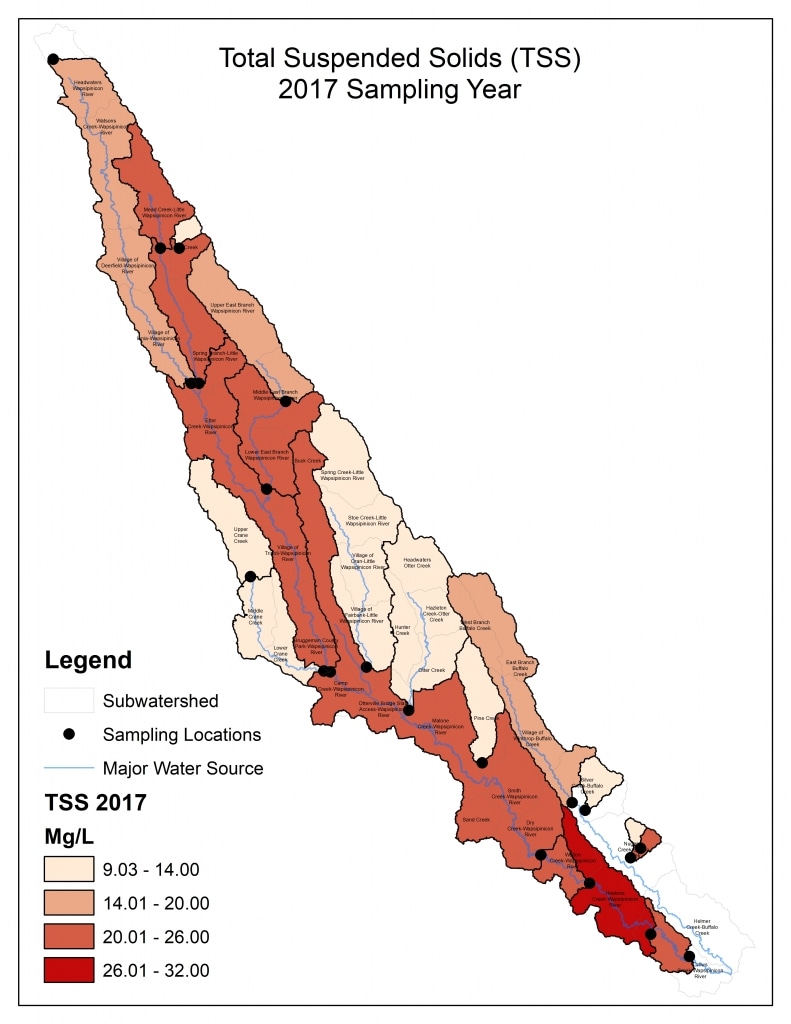 2017 TSS

(Mg/l)
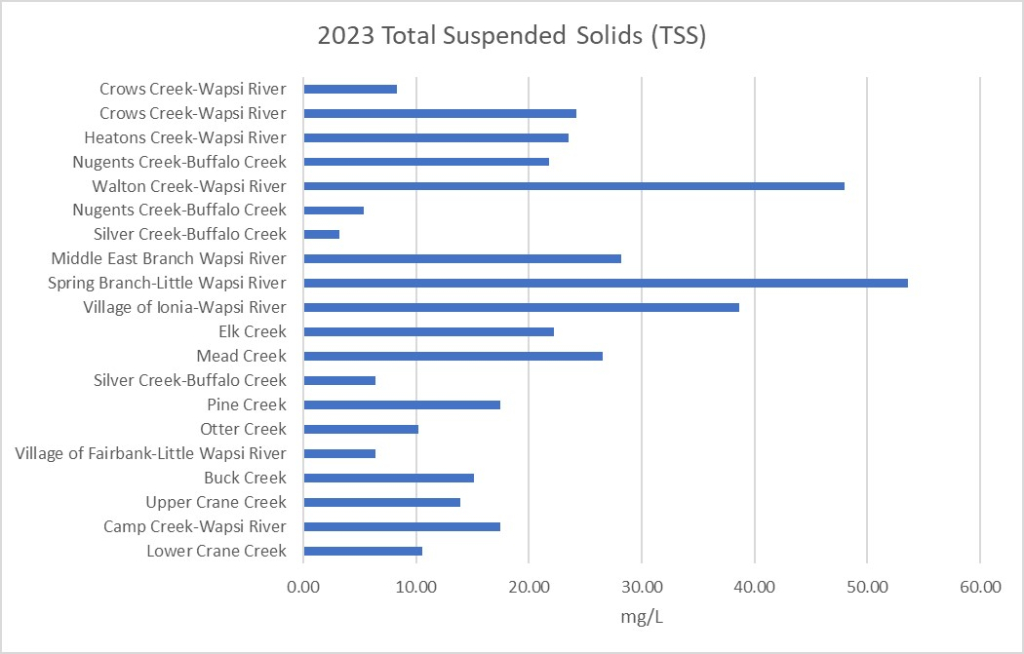
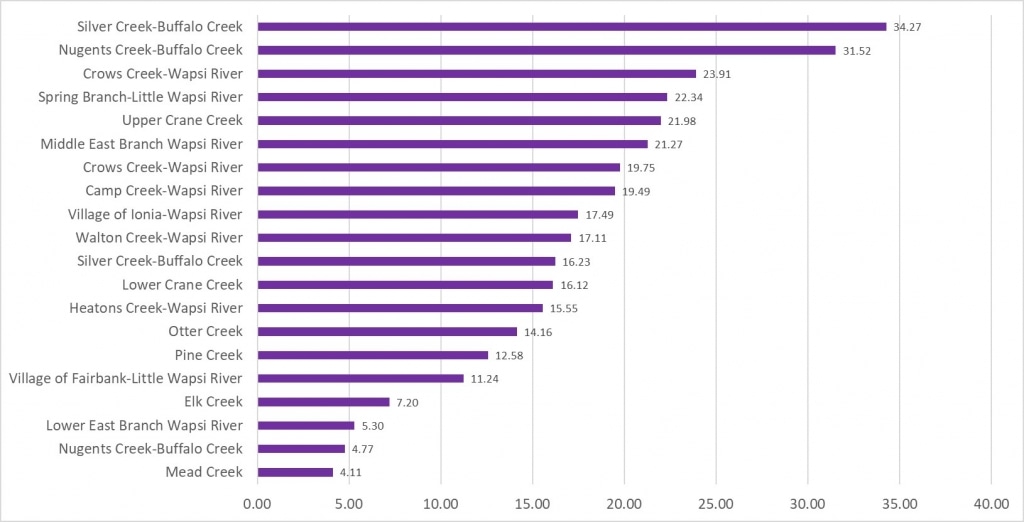
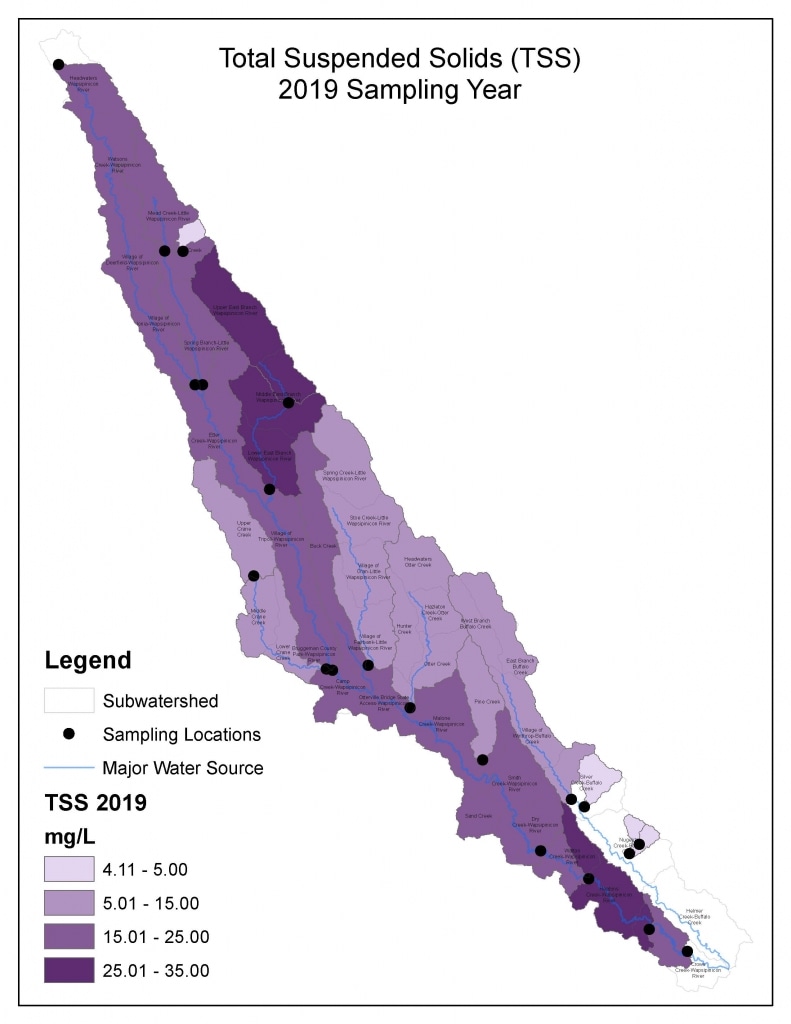 2019 Total Suspended Solids (TSS)
(Mg/l)
![]()
![]()
![]()
![]()