Phosphorus
Phosphorus is an essential nutrient for plants and animals and is usually present in natural waters attached to sediment and organic material. Most elevated levels of phosphorus are caused by human activities, including human, animal, and industrial waste, as well as runoff from fertilized cropland and lawns. Excess phosphorus in water speeds up plant growth, causes algal blooms, and can result in low dissolved oxygen (hypoxic conditions), that can lead to the death of certain fish, invertebrates, and other aquatic life. Phosphorus analyzed using two different methods. One measures the total phosphorus (Total P), by analyzing the sample on an acid preserved sample. The total phosphorus results include both dissolved phosphorus and the phosphorus in plant and animal fragments suspended in the water. Because phosphorus changes forms in nature, total phosphorus gives an overall phosphorus measurement that helps predict the amount of algae and aquatic plant growth that can take place. The second analysis measures dissolved reactive phosphorus, the sample is filtered through a 0.45 micrometer filter prior to analysis. Dissolved reactive phosphorus analysis includes only the phosphorus that is dissolved in the water sample. The amount of phosphate is expressed in milligrams per liter of water (mg/L).
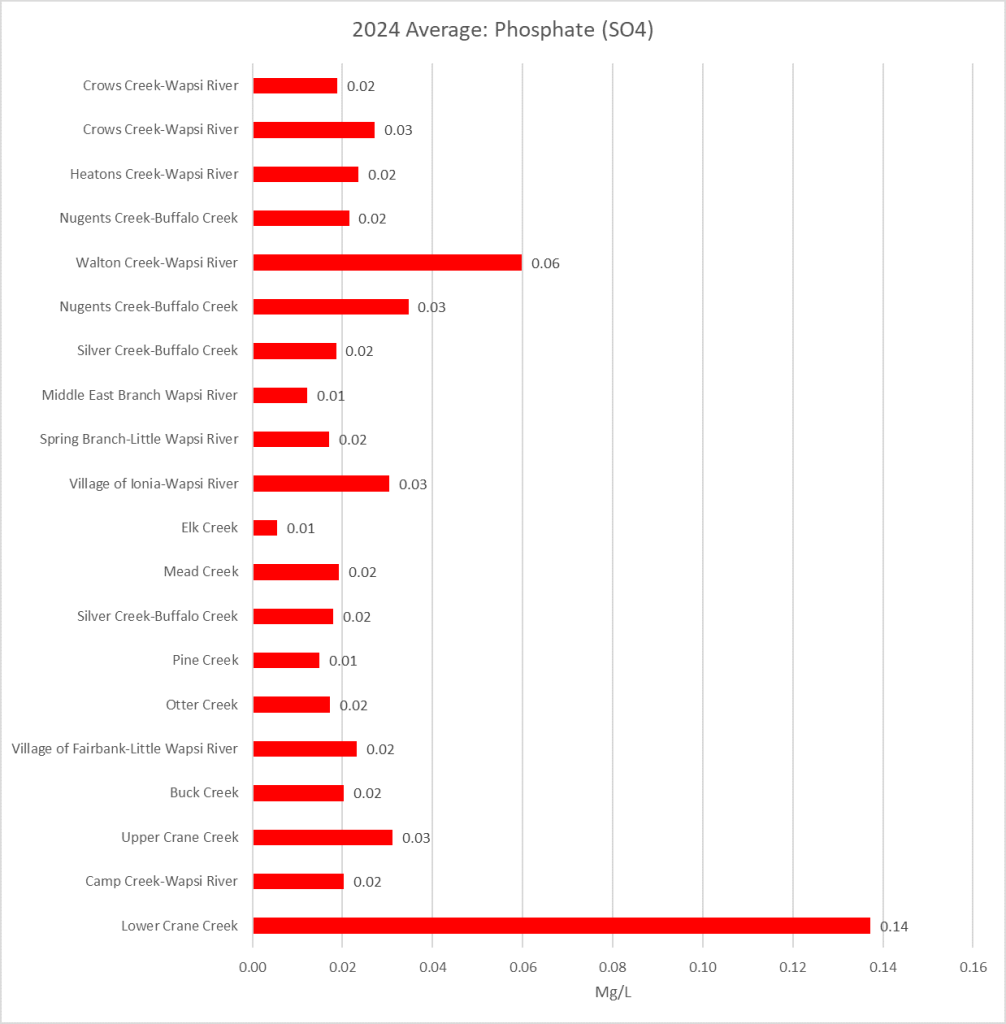
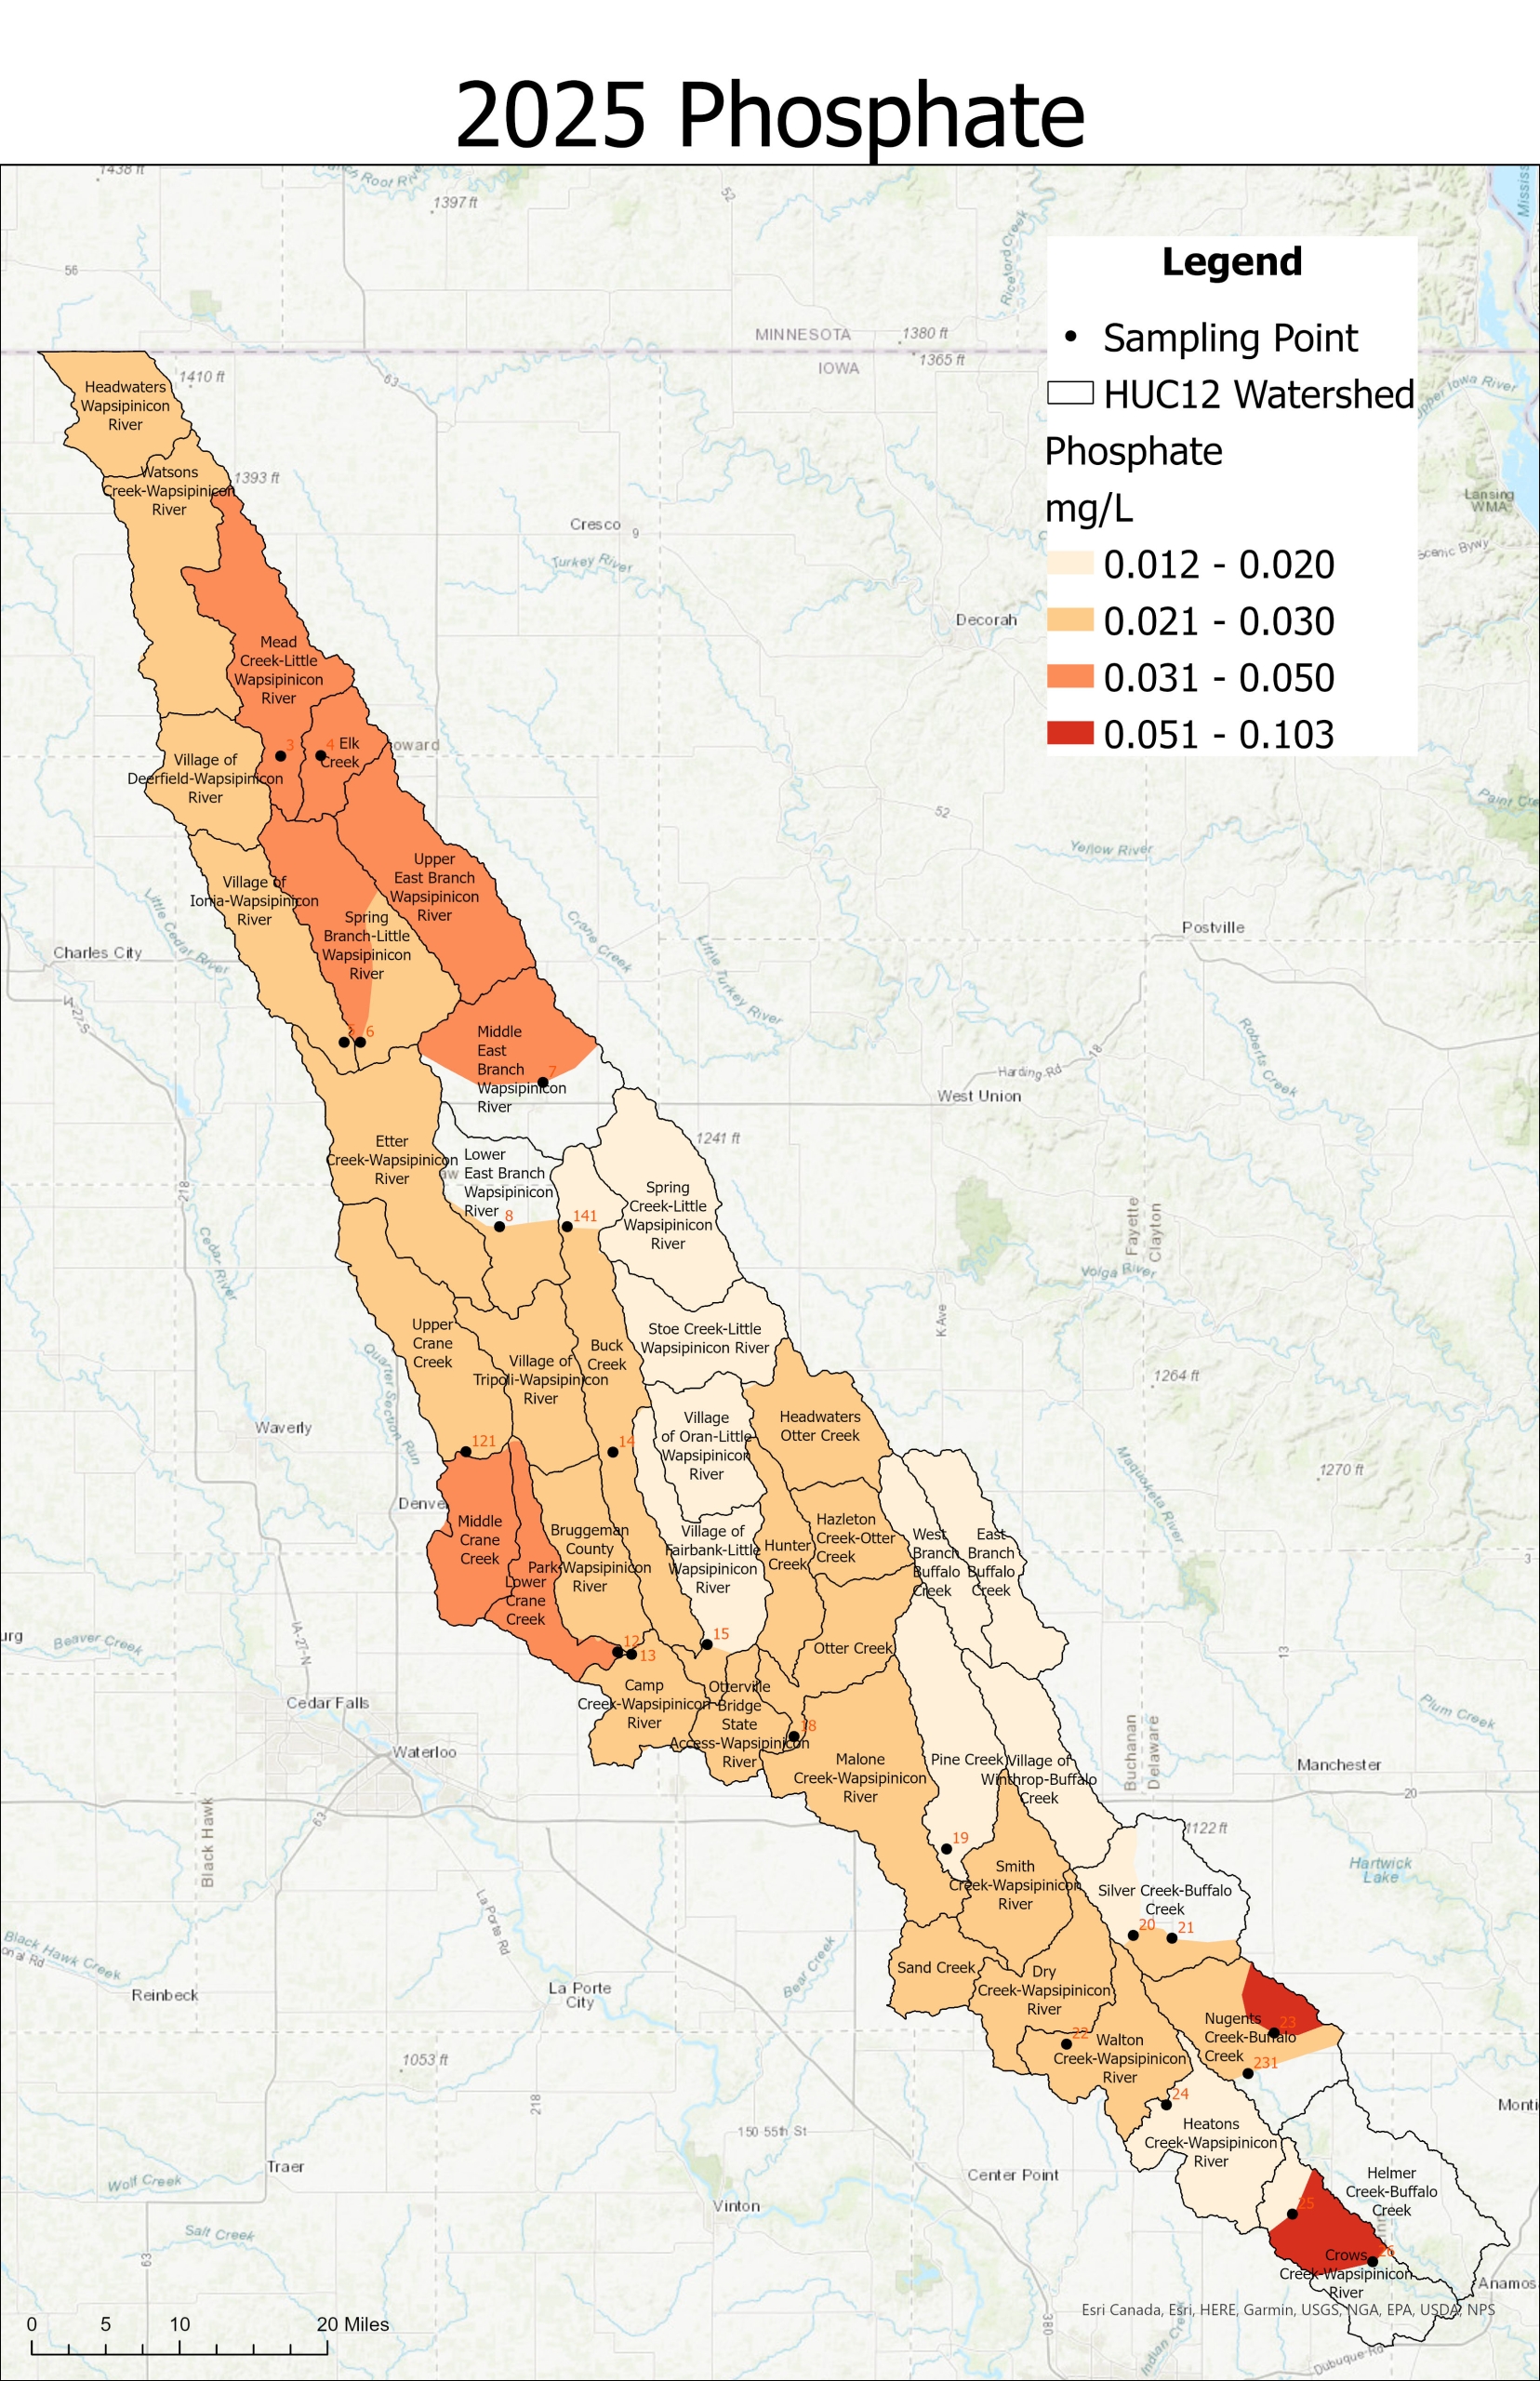
Beginning in 2024 changes in analysis and costs caused the analysis of phosphorus to change from Total P and Dissolved P to Phosphate. Natural phosphate levels in rivers typically range from 0.005 to 0.05 mg/L, but pollution can push these levels significantly higher. Levels above 0.03–0.1 mg/L can stimulate excessive plant growth and harmful algae blooms. (USGS)

2025 Sampling Results
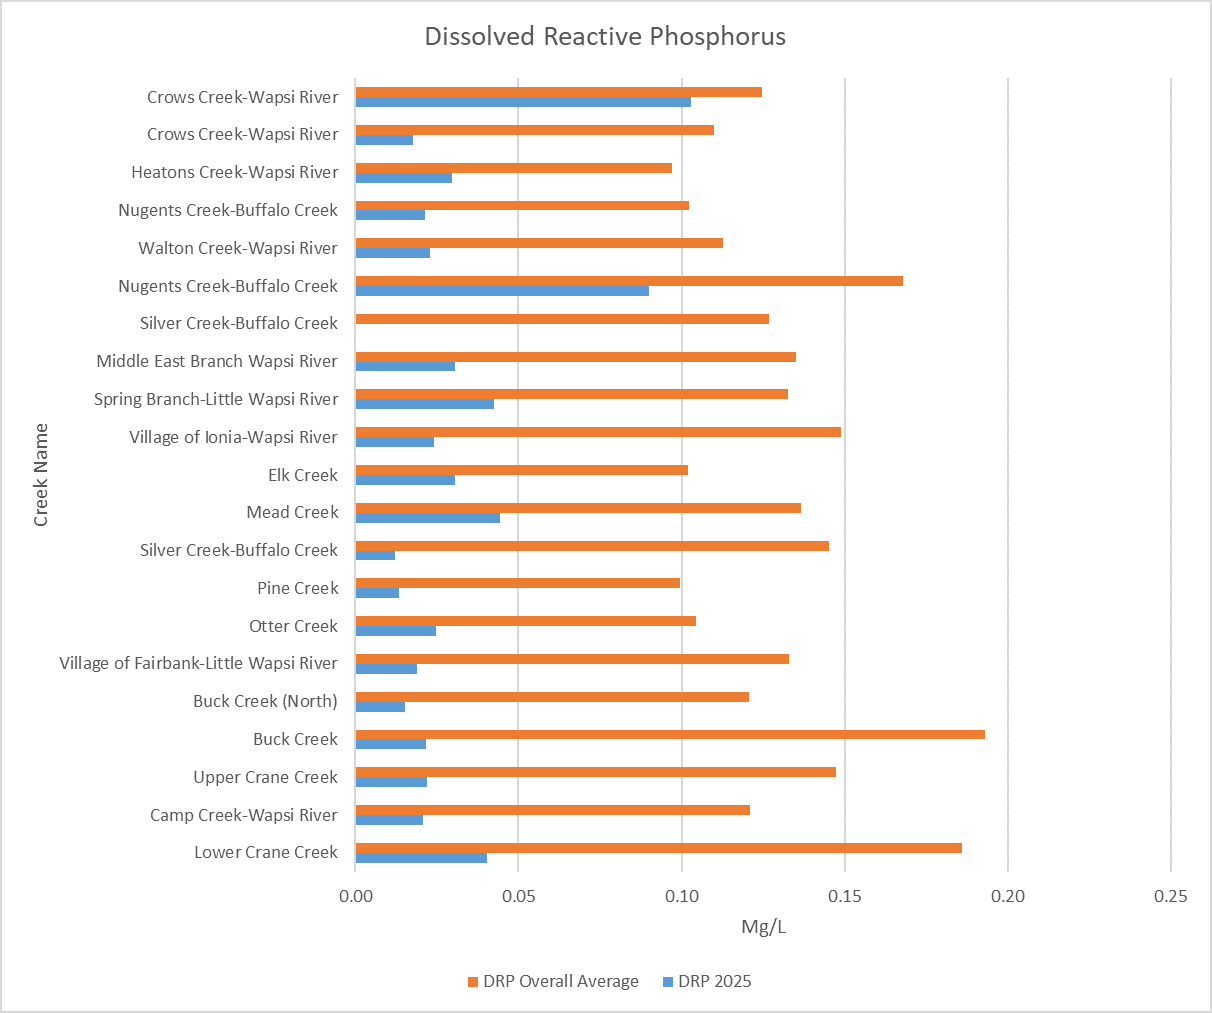

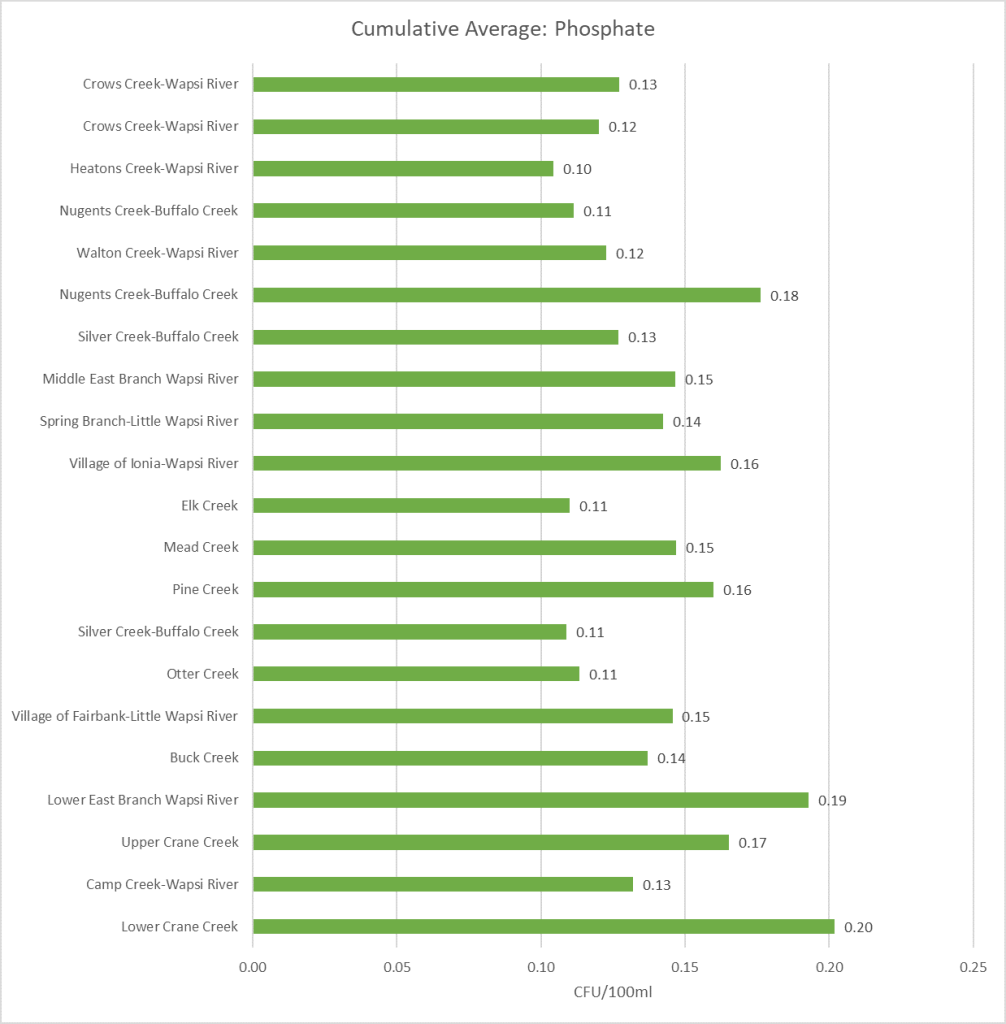
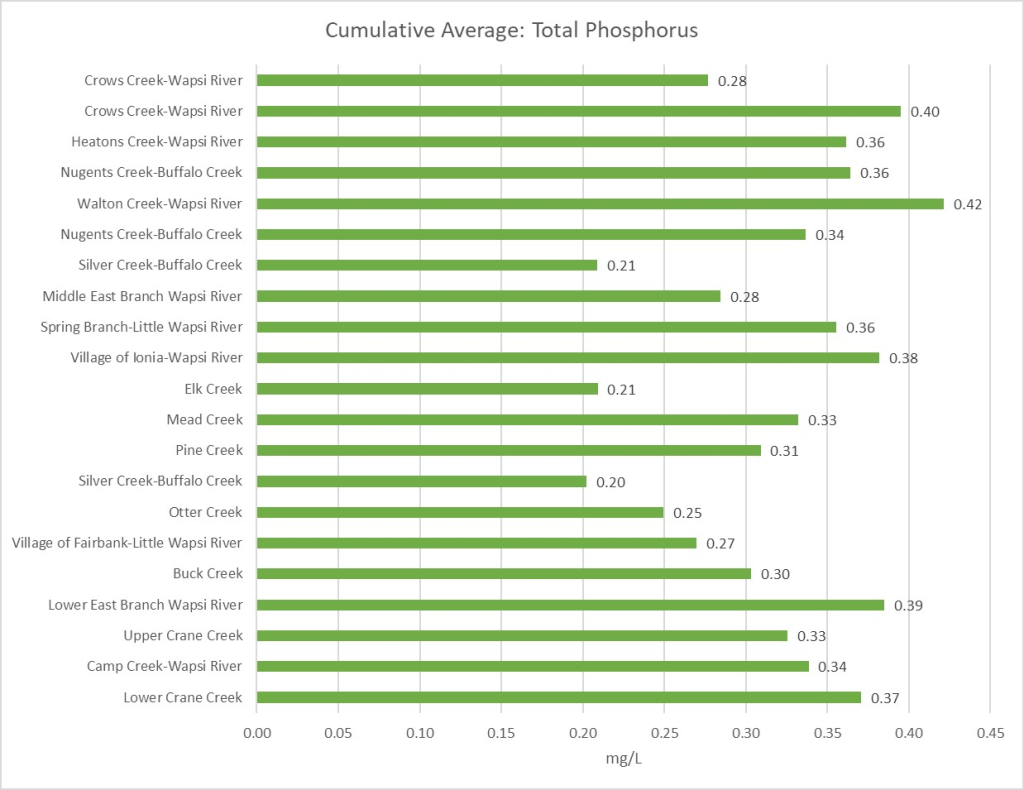
Cumulative Data: Phosphorus

The above image shows all the phosphorus data collected from 2024 and 2025 by using a box and whisker chart. The horizontal line within each box represents the average value in the data, while the lines that extend from the box represent the variation in data. To learn more about how to read a box and whisker chart click here.
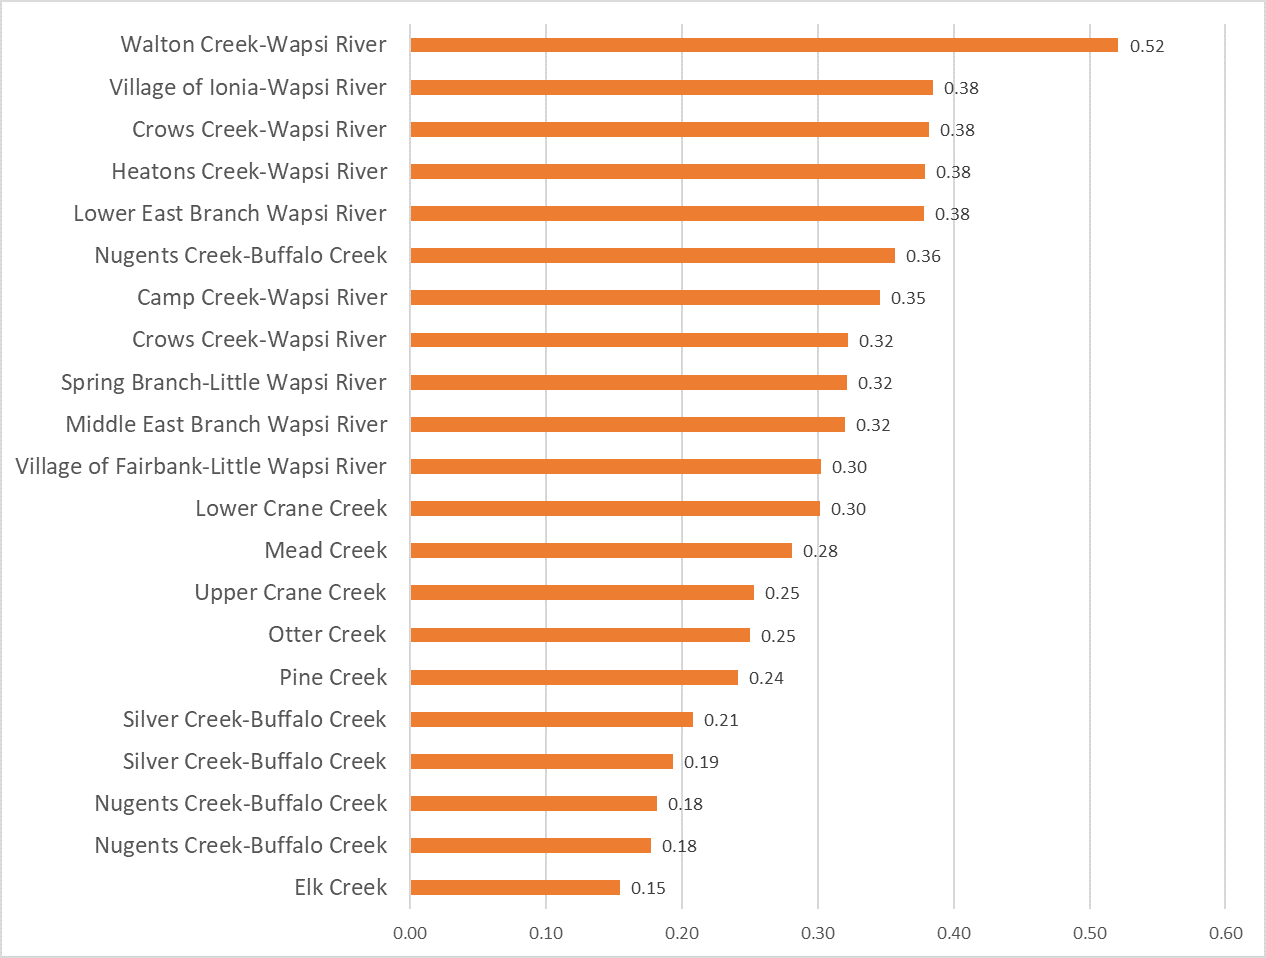
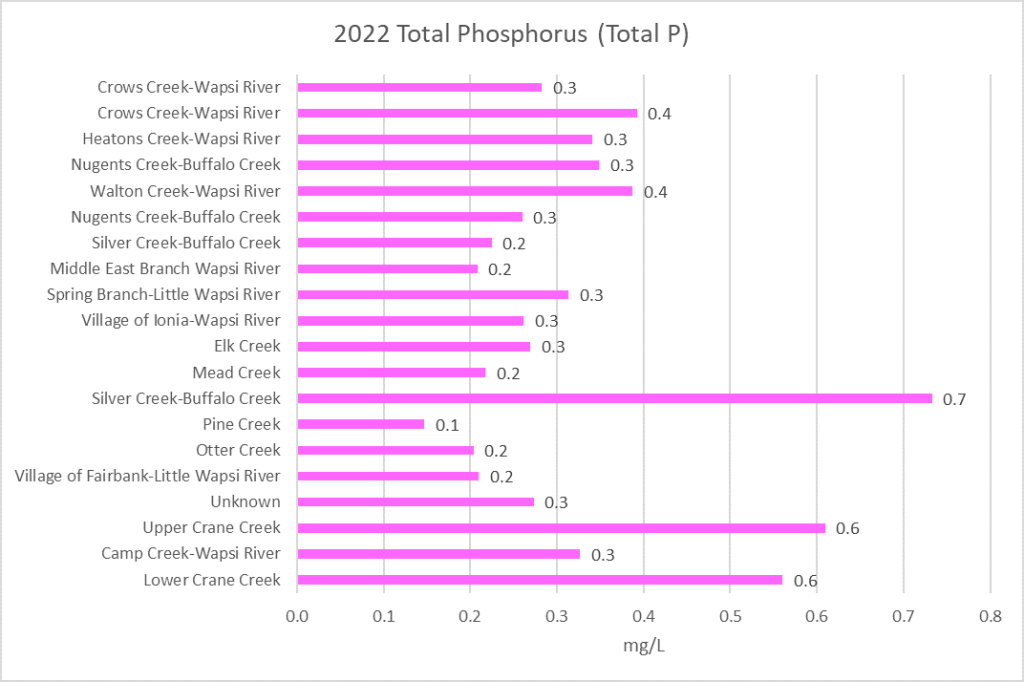
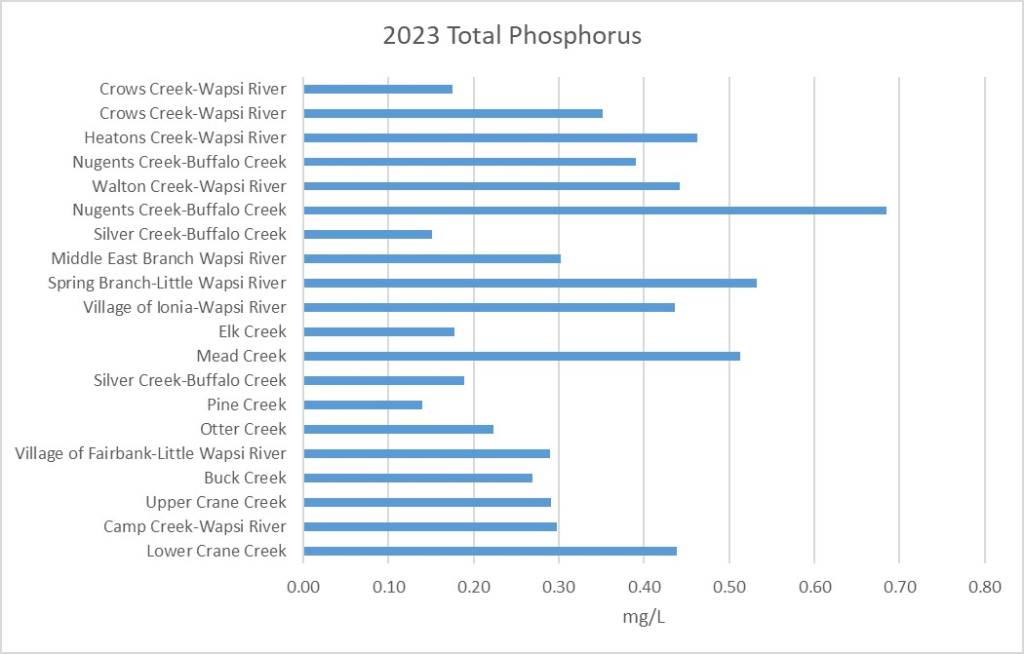
Total Phosphorus Results by Sampling Year
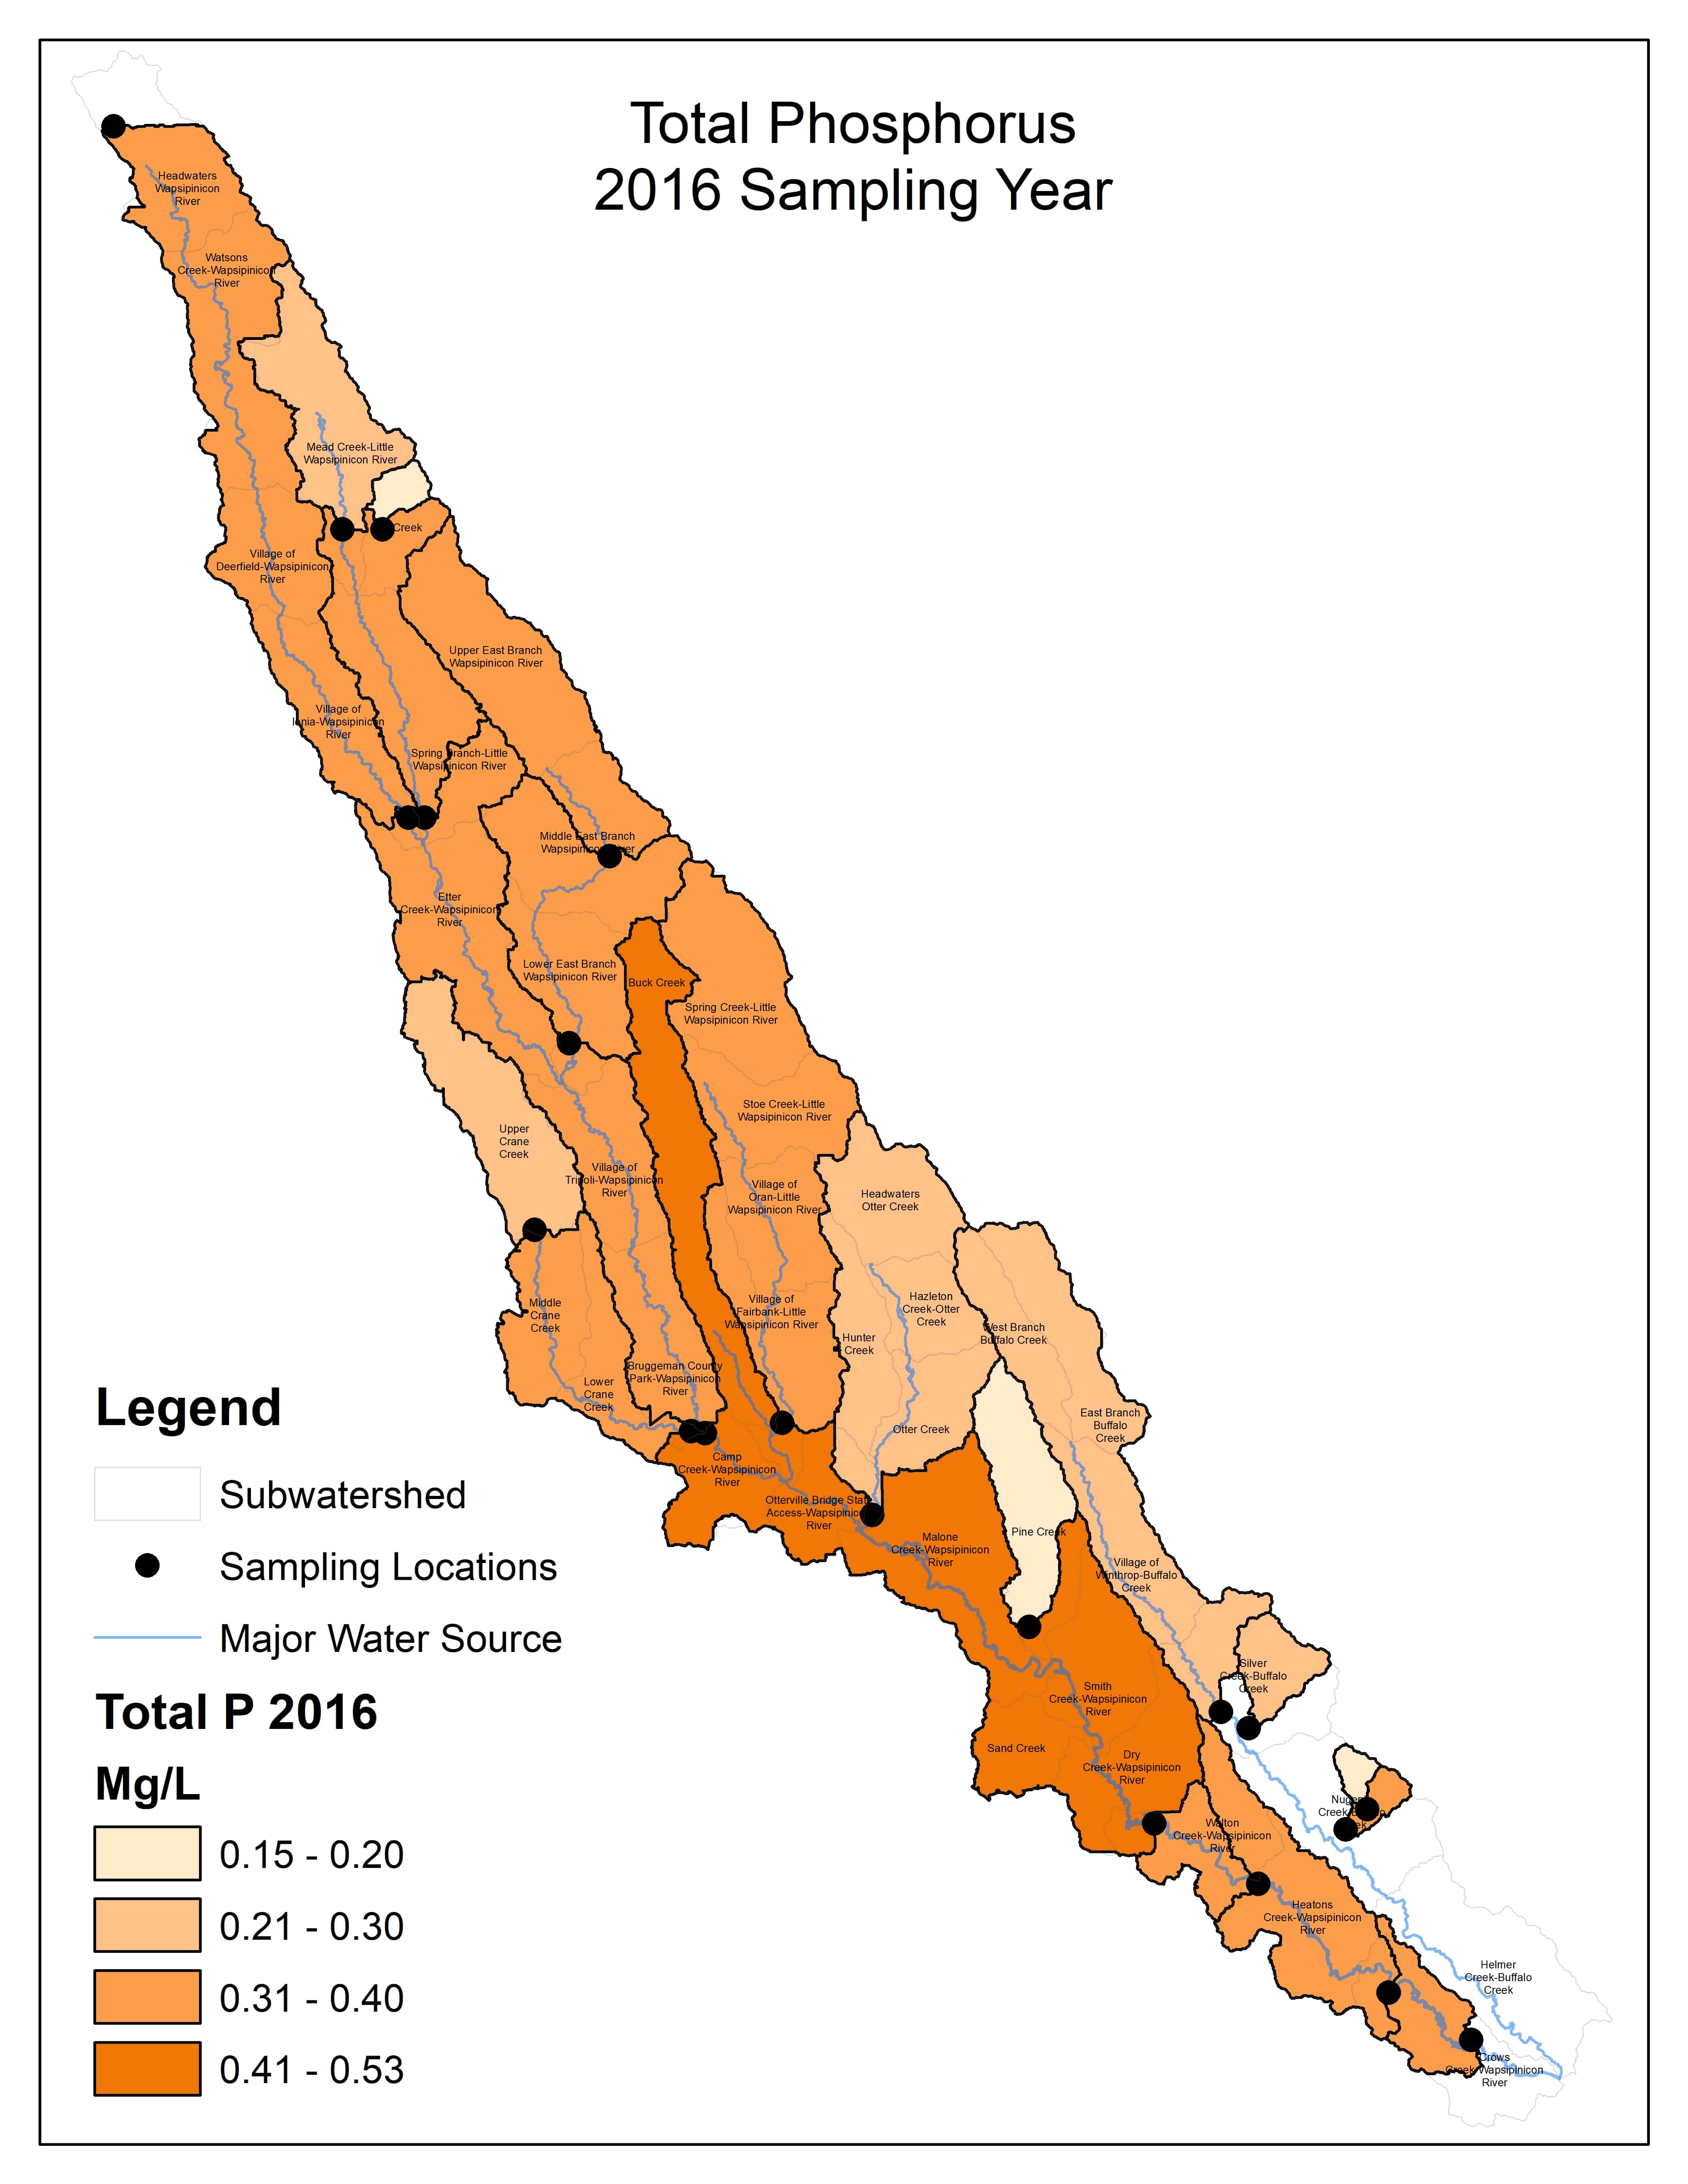
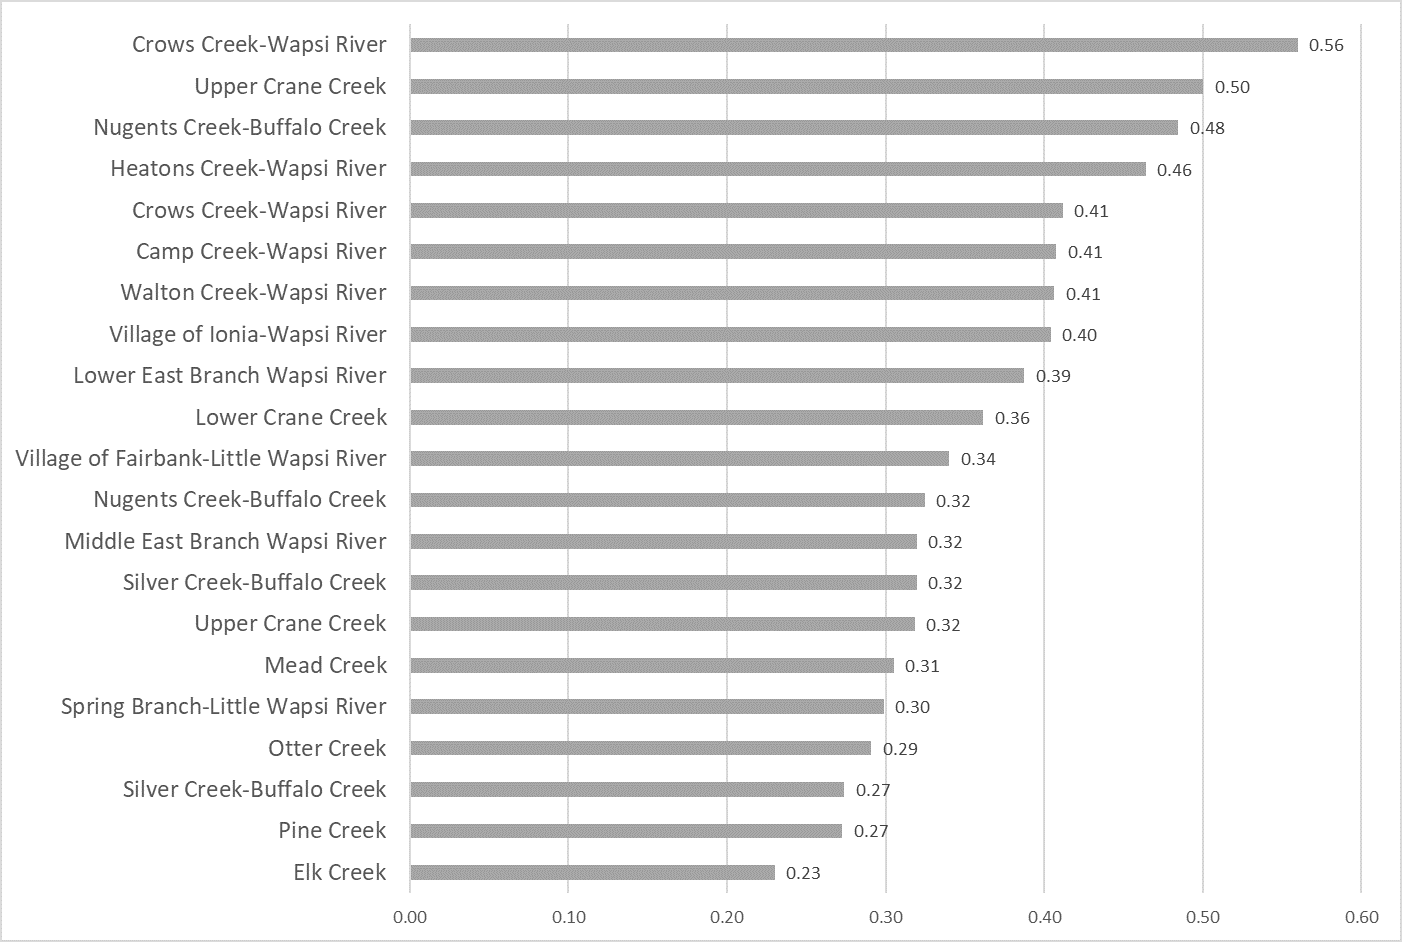
2016 Total Phosphorus
(Mg/l)
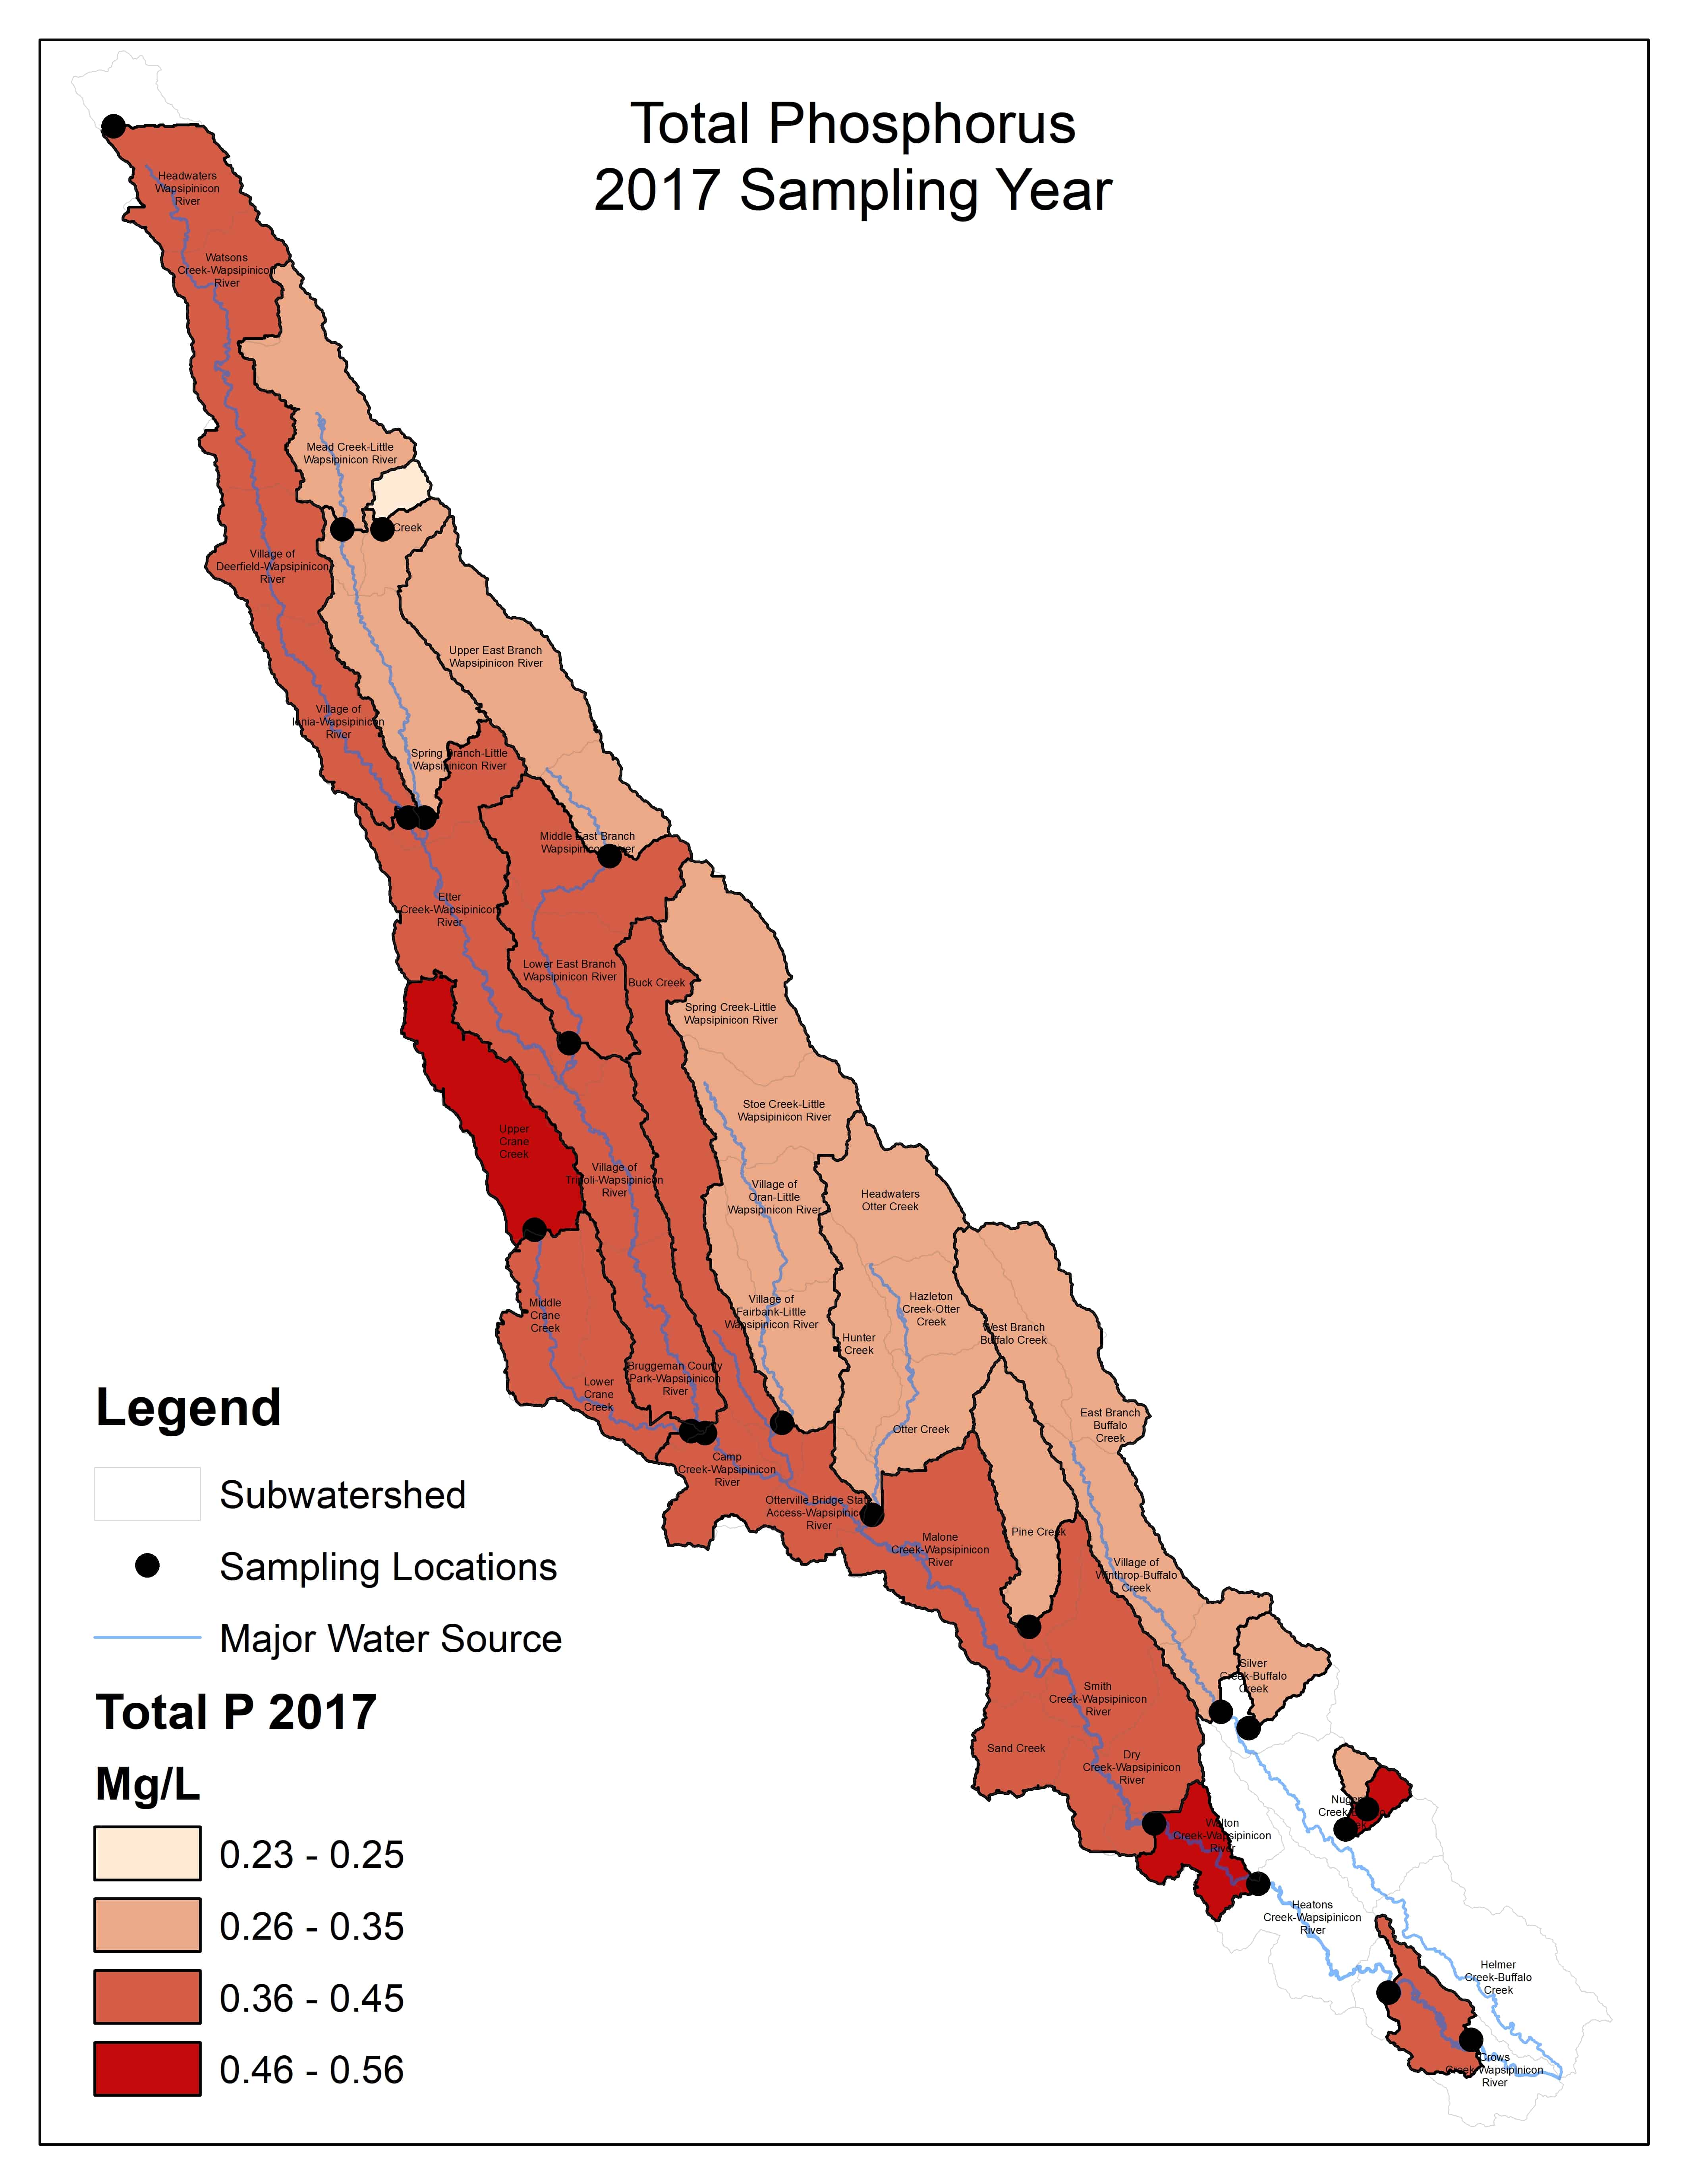
2017 Total Phosphorus
(Mg/l)
![]()
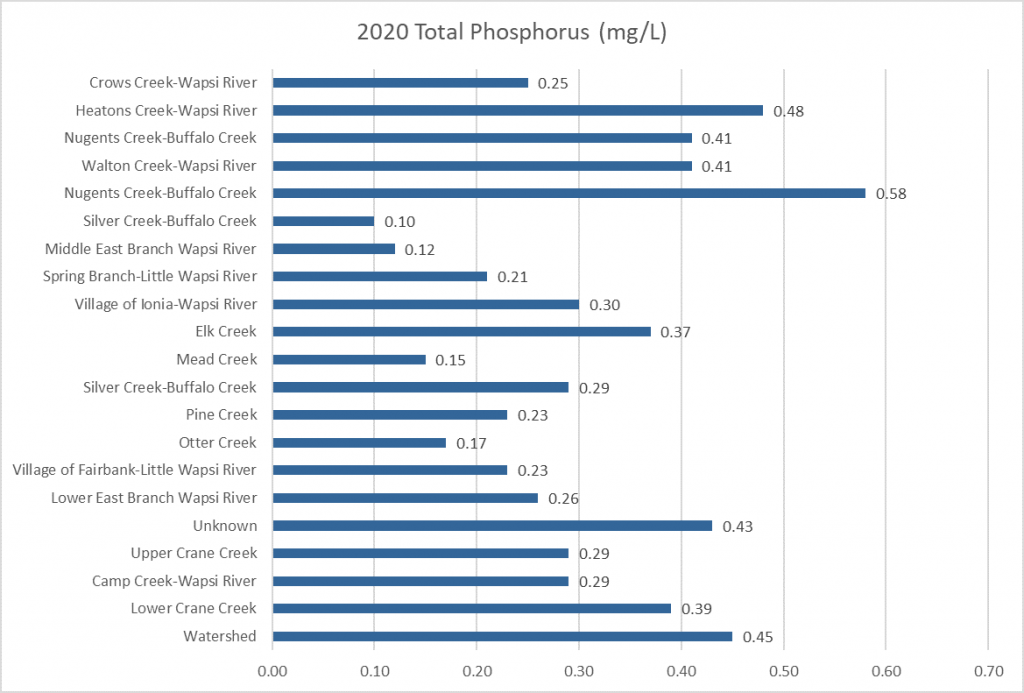
2019 Total Phosphorus
(Mg/l)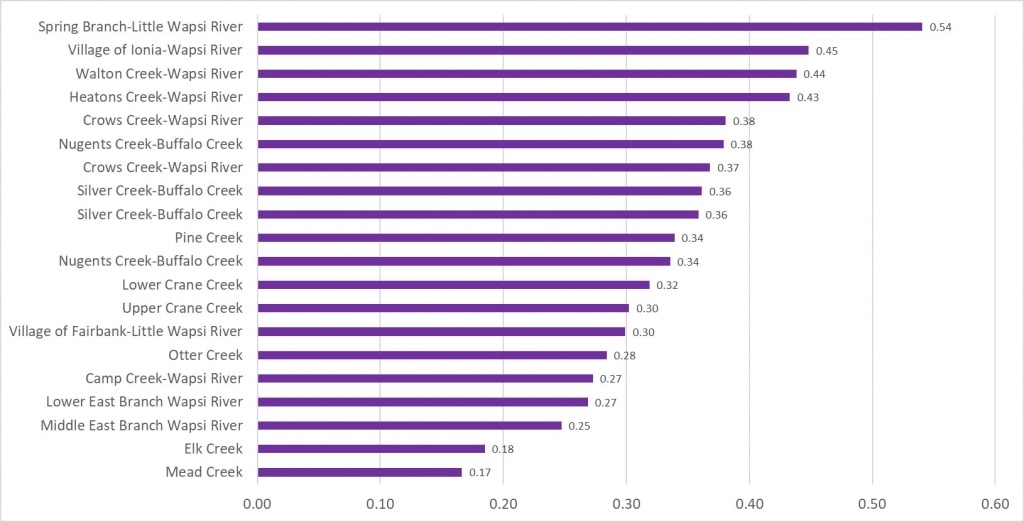
![]()
![]()
![]()
![]()
![]()
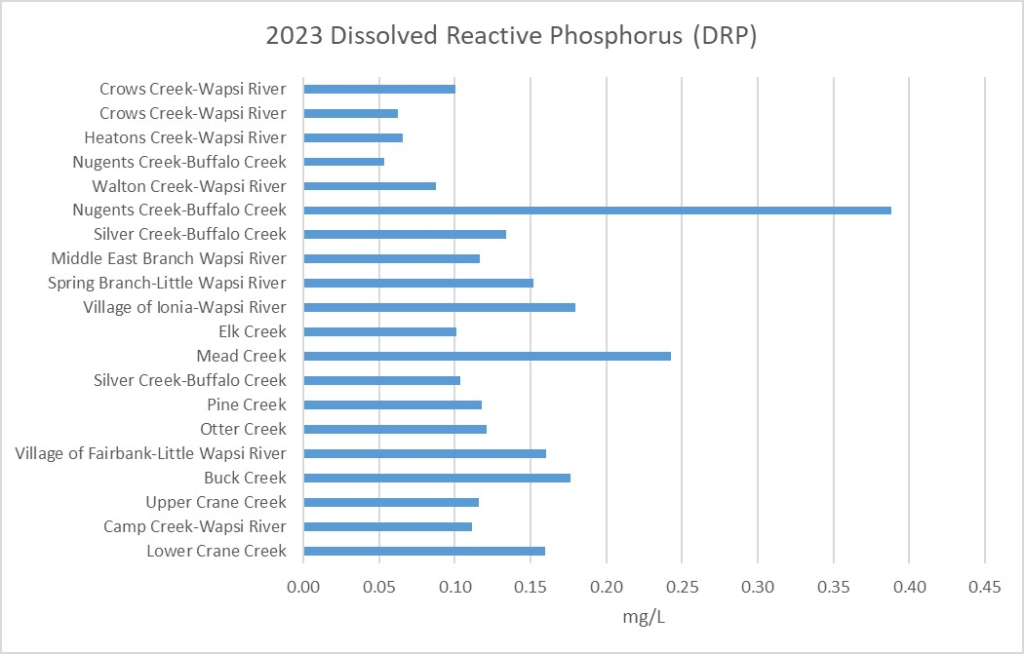
Dissolved Reactive Phosphorus by Sampling Year
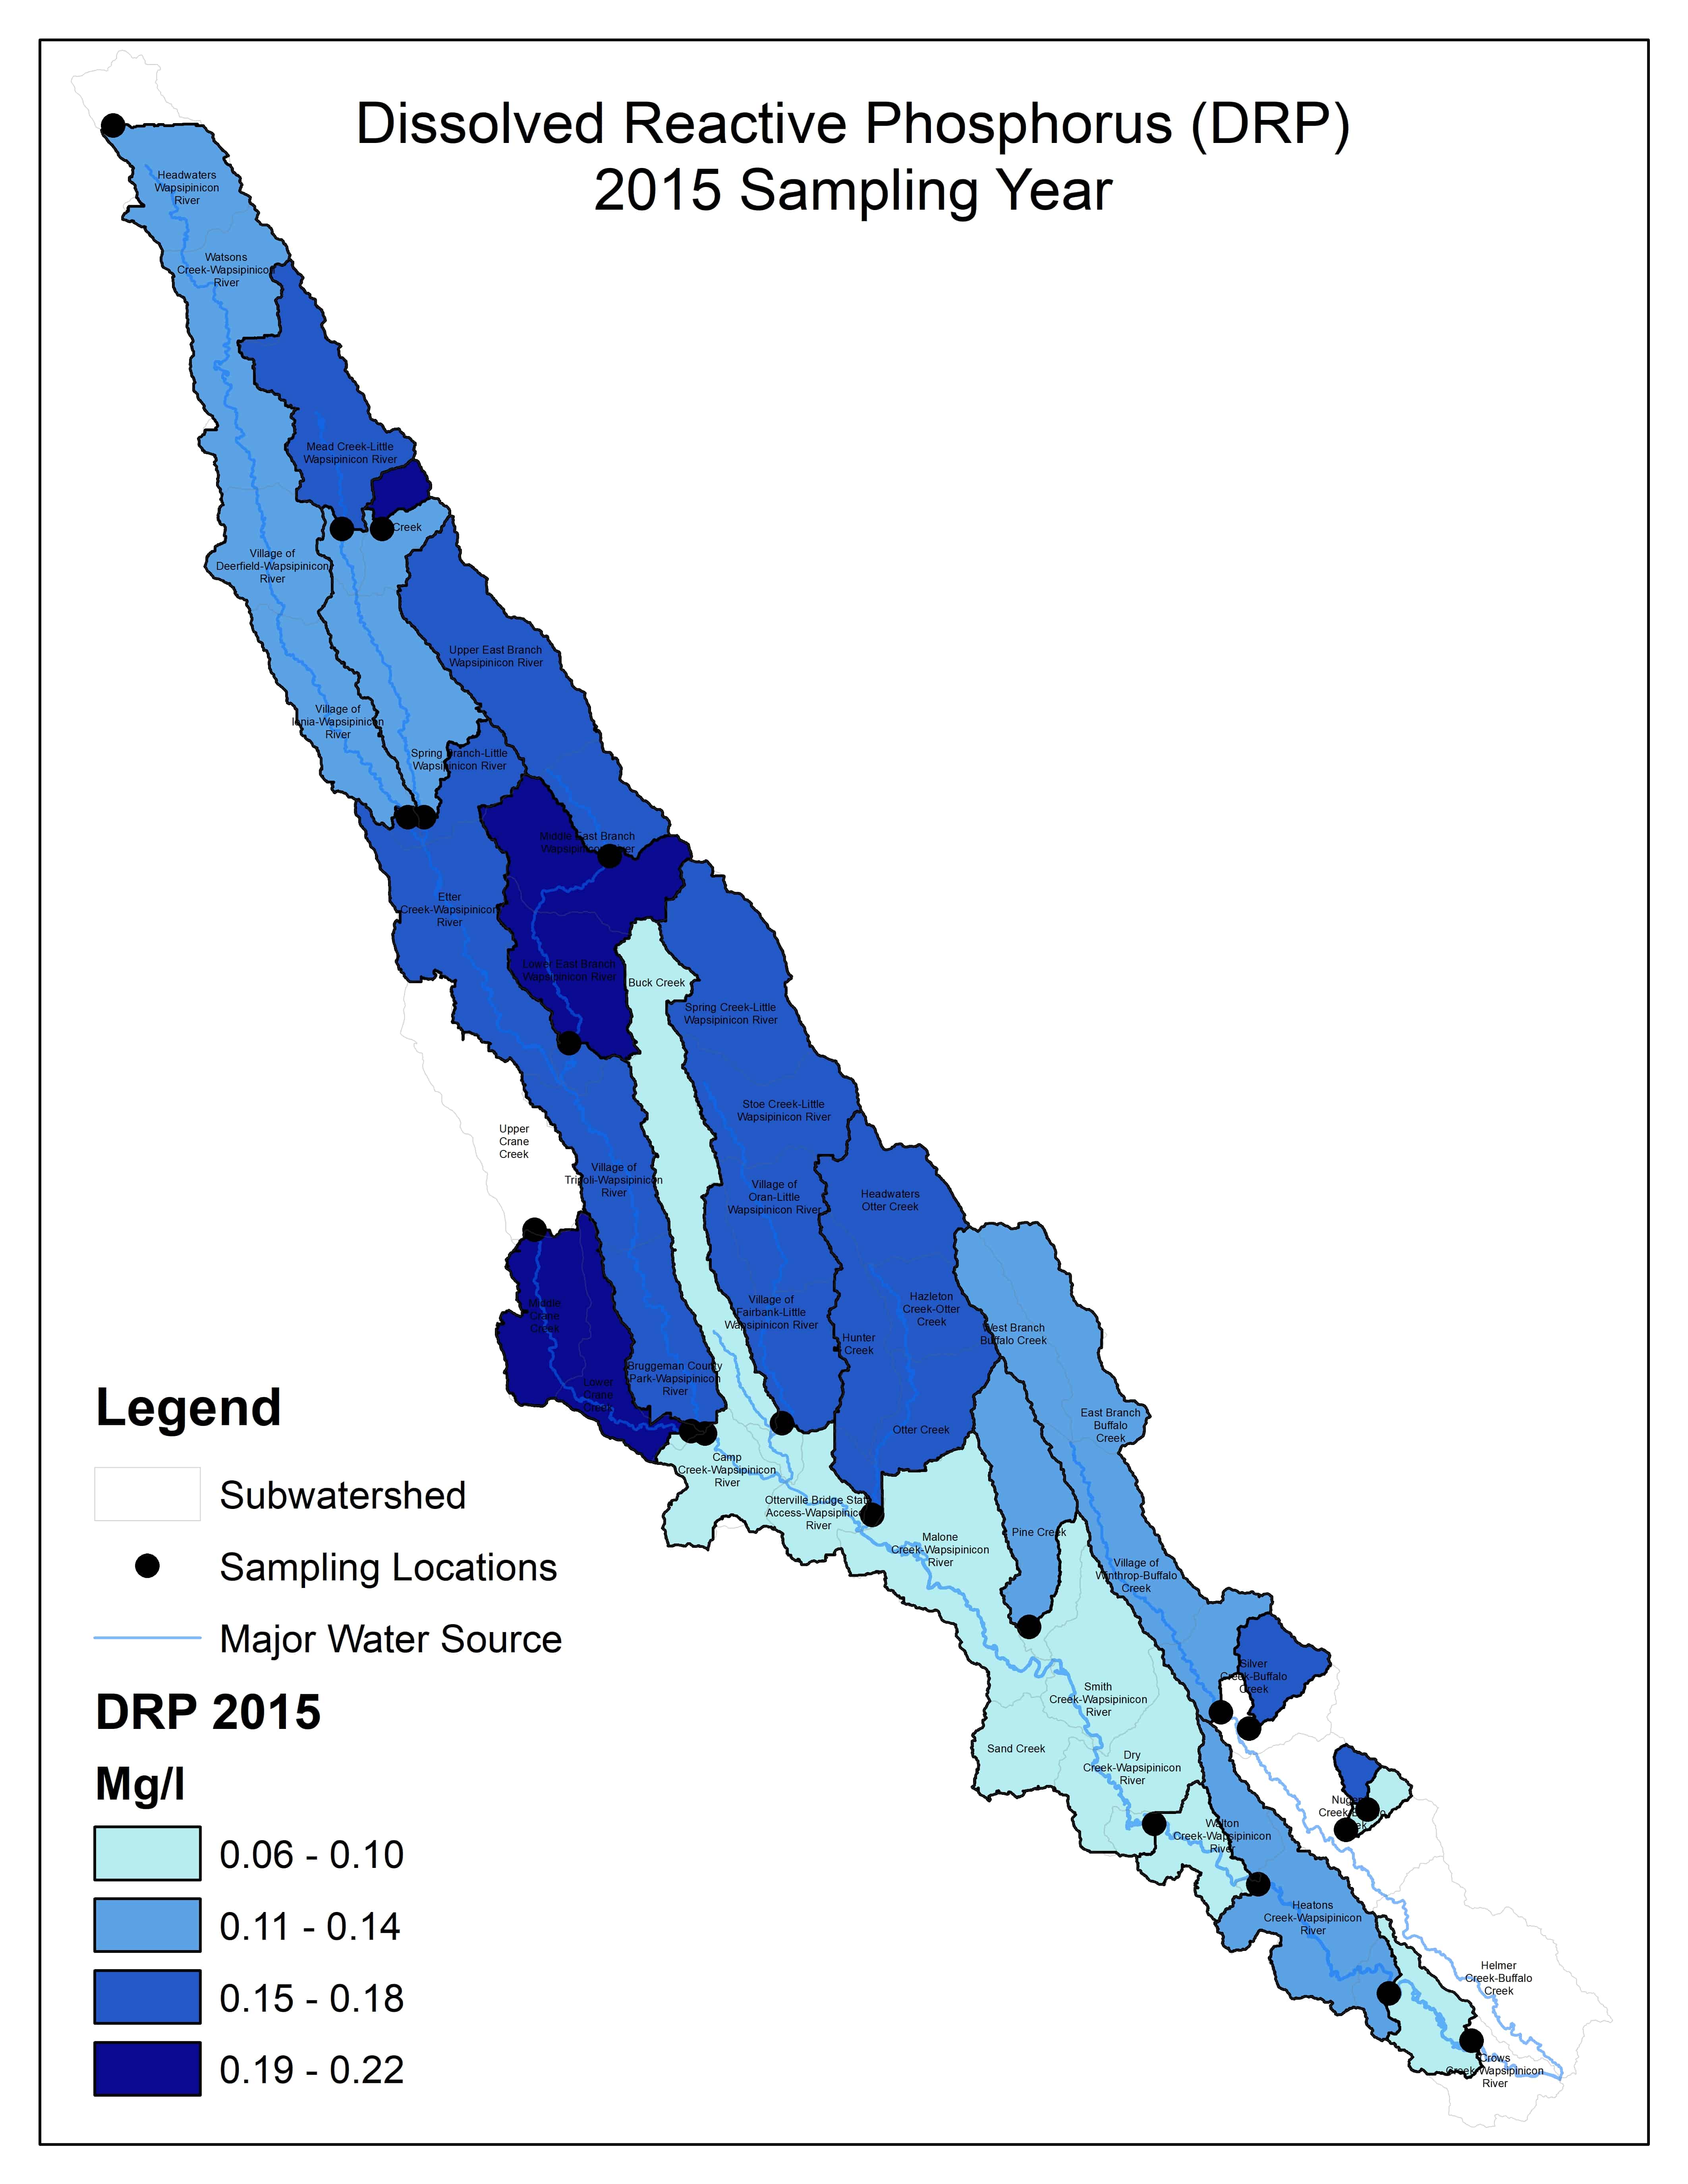
2015 Dissolved Reactive Phosphorus (DRP)
(Mg/l)
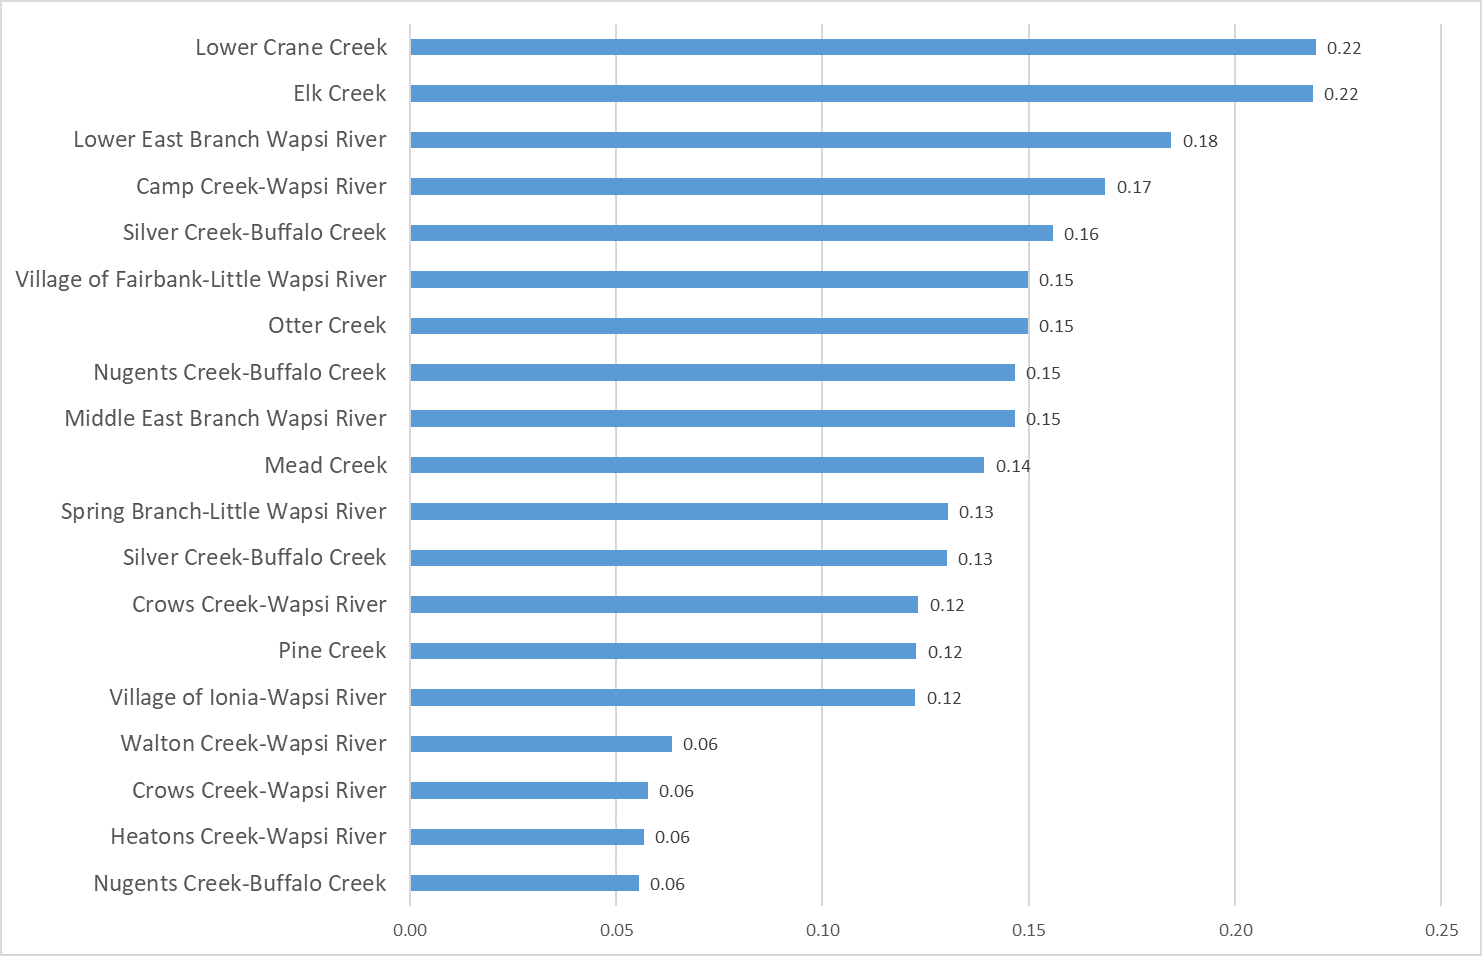
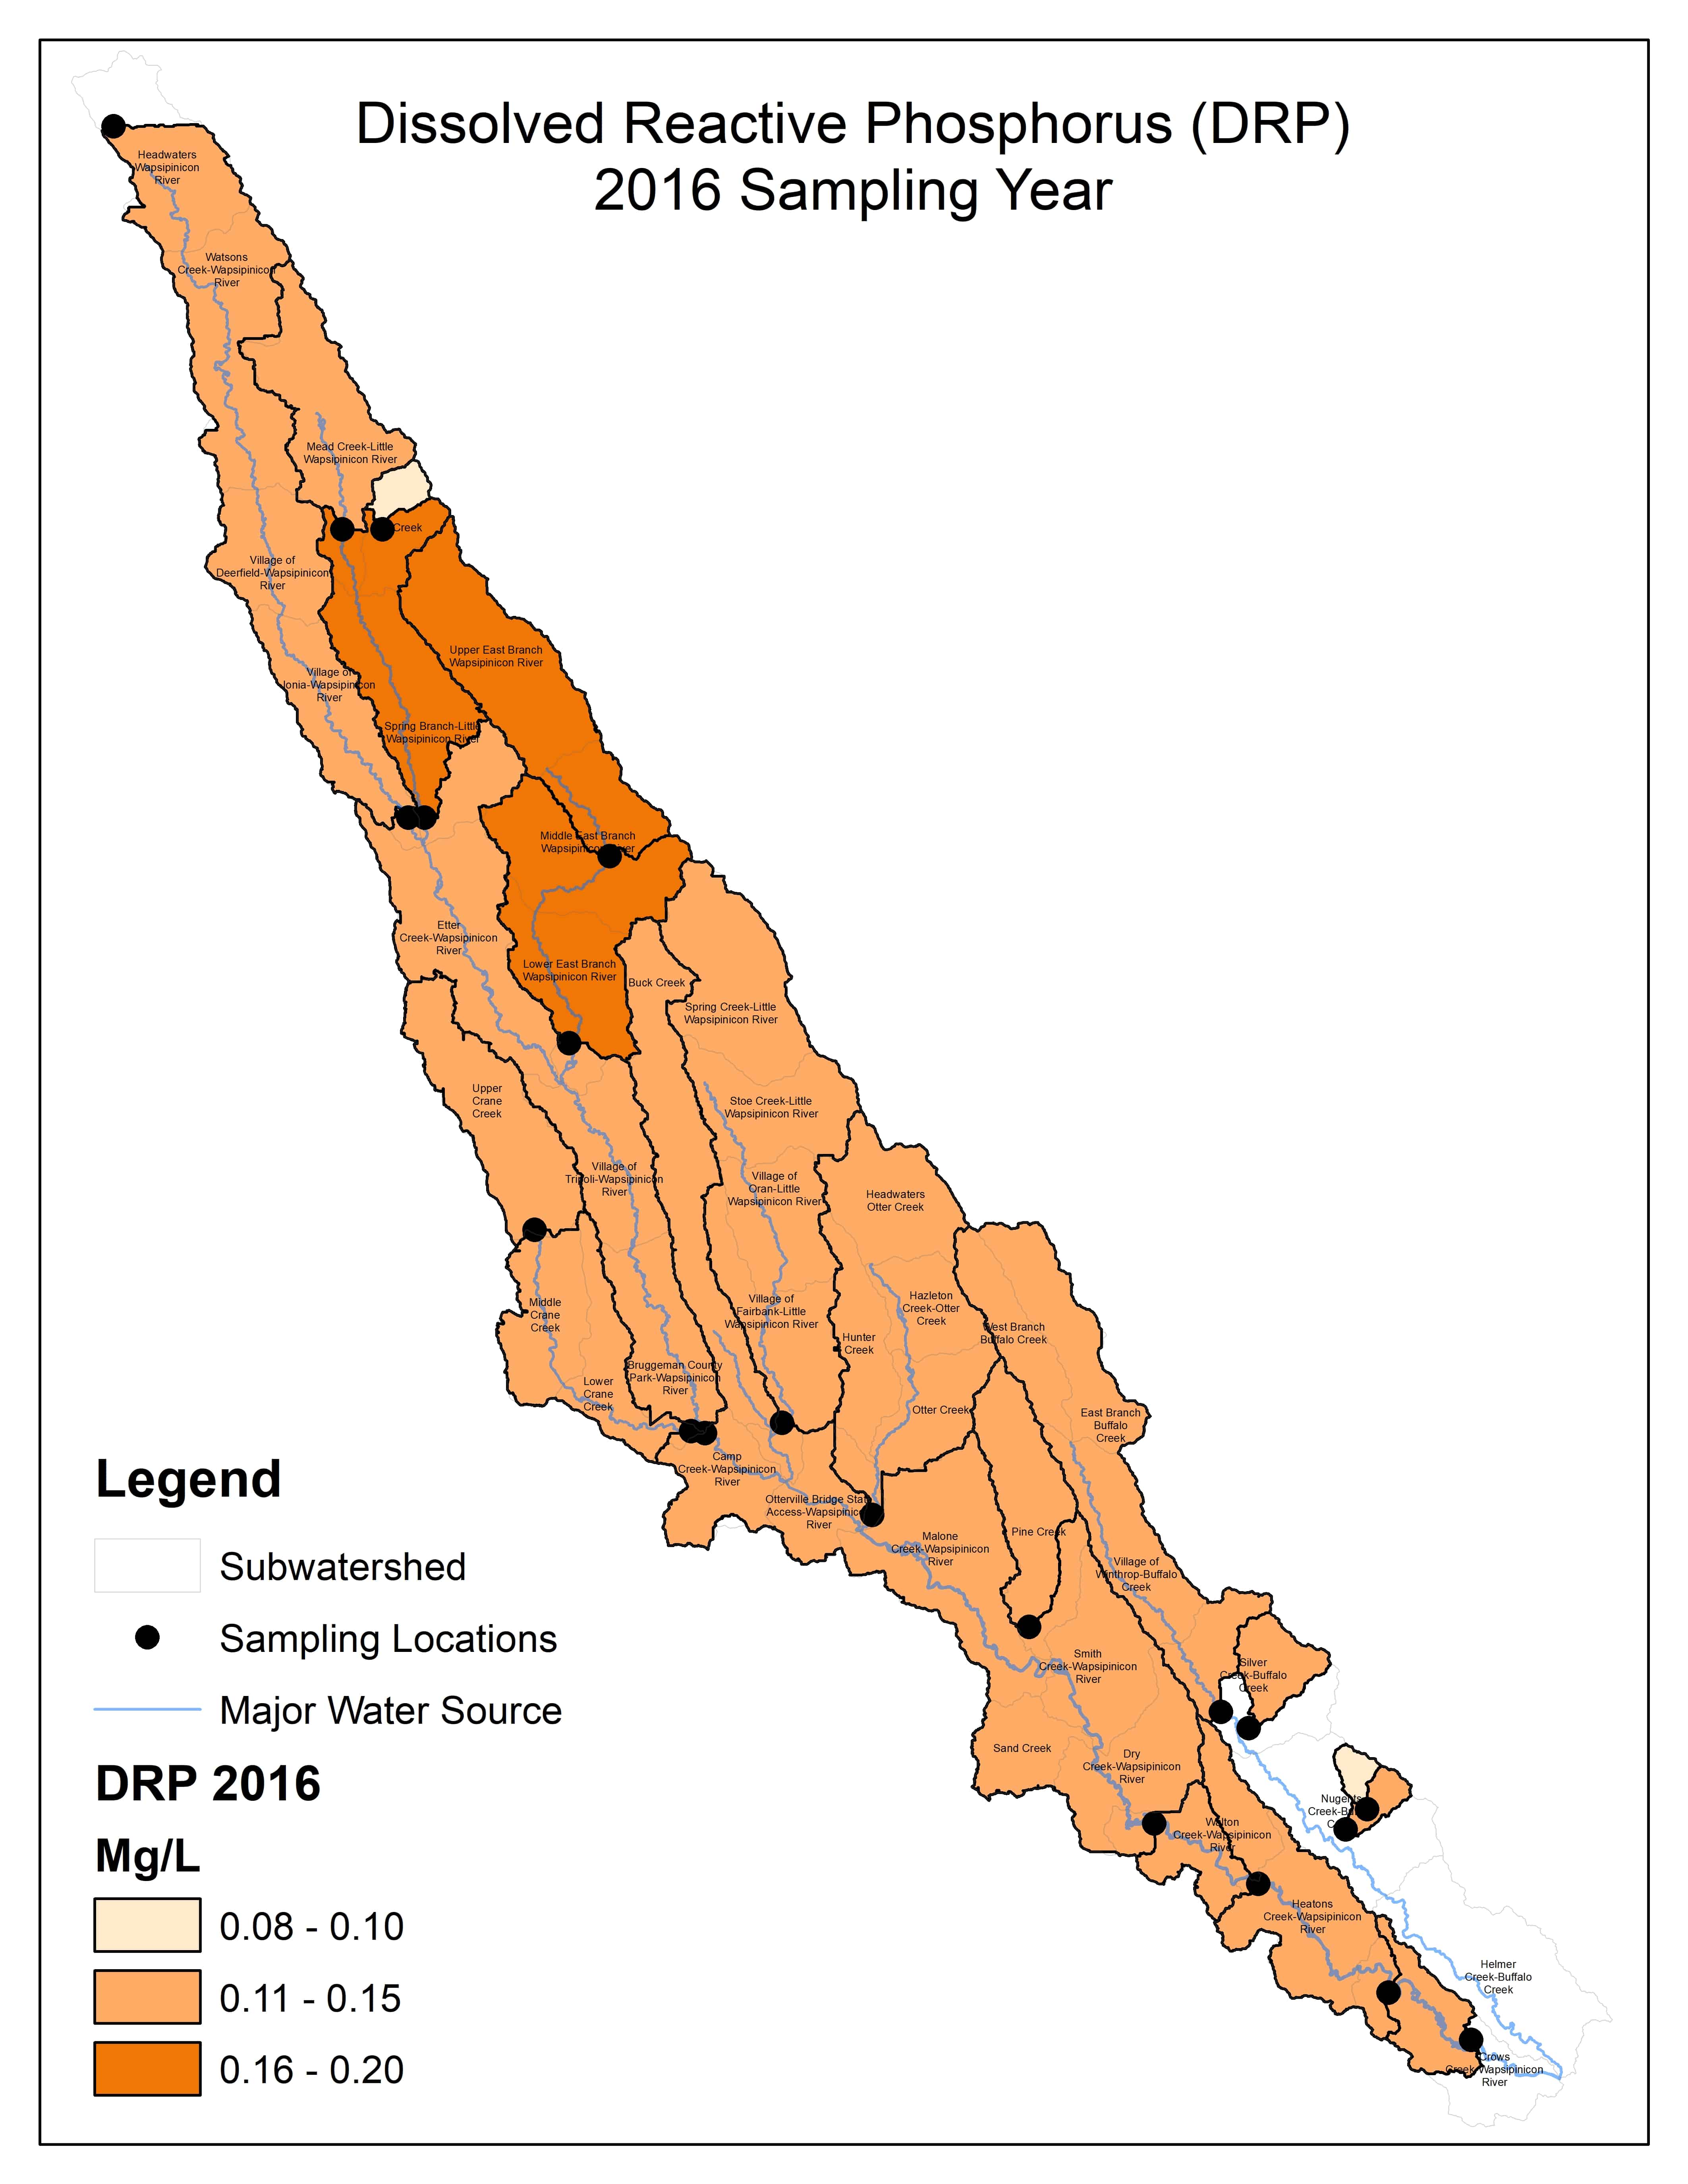
2016 DRP
(Mg/l)

2017 DRP
(Mg/l)

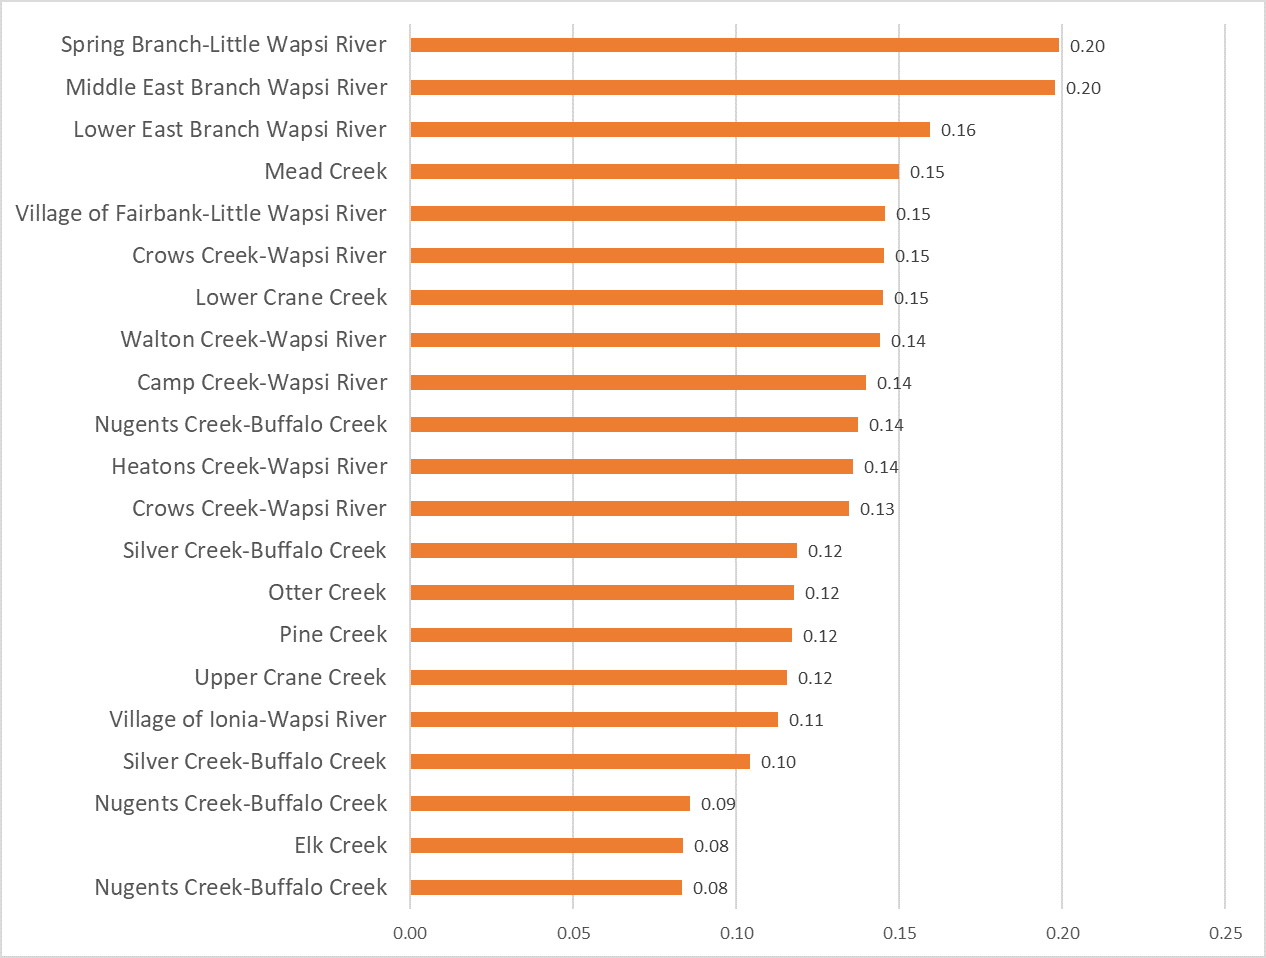
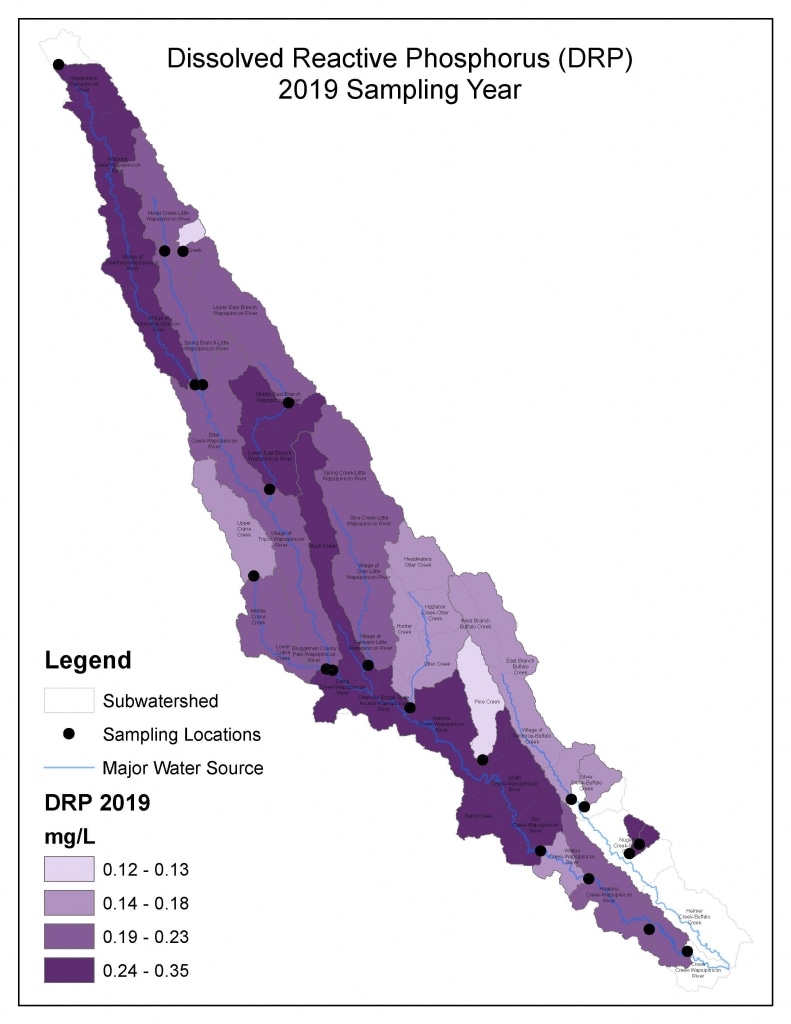 2019 Dissolved Reactive Phosphorus (DRP)
(Mg/l)
![]()
![]()
![]()
![]()